


Iso 27001 dashboard for information security risk management ppt sample




Try Before you Buy Download Free Sample Product
 Impress Your
 Audience
 100%
100% Editable
 Save Hours
 of Time


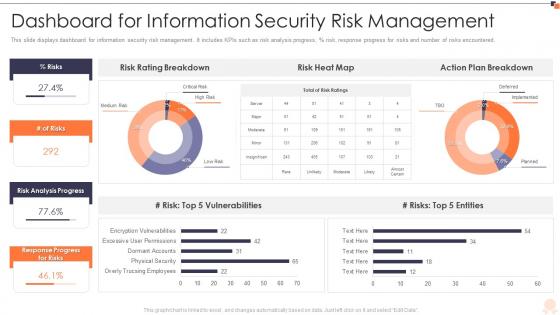
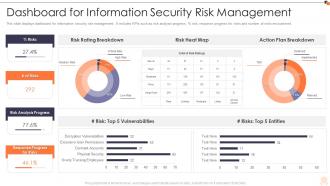
This slide displays dashboard for information security risk management. It includes KPIs such as risk analysis progress, persent risk, response progress for risks and number of risks encountered.
People who downloaded this PowerPoint presentation also viewed the following :
Iso 27001 dashboard for information security risk management ppt sample with all 7 slides:
Use our ISO 27001 Dashboard For Information Security Risk Management Ppt Sample to effectively help you save your valuable time. They are readymade to fit into any presentation structure.





FAQs for Iso 27001 dashboard for information security risk
So for your ISO 27001 dashboard, definitely track risk assessments, incident numbers, and compliance scores first. Asset inventory and how well your security controls are actually working matter too. Oh and vulnerability stats - auditors love asking about those. Training completion rates are huge since people always forget to finish their modules. The whole point is giving execs a quick snapshot of whether you're hitting security goals or if something needs fixing. Honestly, start simple with these basics then build out more detailed stuff once everything's running smoothly. Don't overcomplicate it right away.
Honestly, an ISO 27001 dashboard is a game changer - it puts all your security metrics in one spot so you're not drowning in spreadsheets anymore. You'll see compliance status, risk levels, audit findings, the whole nine yards. The real magic happens when you set up alerts for critical stuff. No more manual checking every five minutes like some kind of security paranoid person (which, let's be real, we all are). It shows trends before they bite you and gives leadership actual numbers to look at. My advice? Figure out what metrics actually matter to your company first, then build around those.
Start with risk assessment status and incident response times - those are your bread and butter. Security control effectiveness matters too, plus audit findings and any corrective actions. Don't sleep on training completion rates though, they tell you way more about your actual security culture than people think. Vulnerability management metrics are solid picks as well. Asset inventory accuracy and business continuity test results round it out nicely. Honestly, pick like 6-8 metrics that'll actually impress your auditors and stakeholders first. You can always add more later once you've got the basics dialed in.
Dude, real-time analytics completely change your ISO 27001 game. Your dashboard stops being this boring static thing and actually catches problems when they're happening. Like, instead of finding out about sketchy login attempts three weeks later, you'll see them immediately. Failed authentications spiking? You'll know right away. Same with weird access patterns or whatever. Your risk assessments stay fresh since data's flowing constantly - not showing you ancient history from last quarter. Honestly feels like having security superpowers sometimes. Just figure out which events you need to see instantly, then set up alerts for those specific things.
So basically, your ISO 27001 dashboard needs to show the risks that actually matter. Map your biggest threats to specific widgets that help you make real decisions - like incident trends, how well your controls are working, stuff like that. It's honestly like a car dashboard showing what keeps you from crashing. Real-time views of high-priority risks are huge here. You want to catch problems early, not after everything's already gone sideways. Track your mitigation progress too - otherwise you're just flying blind on whether your security measures are doing anything.
Most dashboard platforms let you drag and drop custom widgets for your specific industry stuff - like PCI DSS if you're in finance or HIPAA for healthcare. Map your sector's controls directly to the KPIs you're tracking. Set up different views for different people so executives aren't drowning in technical details (trust me, they hate that). The automated reporting is clutch - just sync it with your audit schedule. Honestly, start by figuring out which regulatory overlaps actually matter to your business first. Then build those into your dashboard views. Way easier than trying to track everything at once.
Color code your incident severity - red for critical, amber for medium, green for low. Track resolution times against your SLAs too. Heat maps work really well here, honestly way better than boring charts. Break down incidents by type (malware, phishing, data breaches, whatever). Show both open and closed counts so people can see the full picture. Trends over time are crucial - leadership loves spotting patterns. Oh, and make sure it's detailed enough for your security team to actually prioritize work, but not so granular that executives' eyes glaze over.
Look, dashboards basically save you from drowning everyone in boring compliance reports nobody reads anyway. Real-time risk charts and control metrics actually make sense to both your IT folks and the C-suite. Those quarterly meetings where people's eyes glaze over? Way better now. You'll want different views for different people - what your CISO cares about isn't the same stuff your compliance team needs. Set up automated reports so you're not stuck manually pulling data every month. Honestly makes the whole ISO 27001 thing way less painful to manage.
Honestly, the worst part is usually getting all your data to play nice together. IT tracks stuff one way, compliance does their own thing, and security has completely different metrics. It's a mess. Then you've got people who hate changing how they do reports - because why make life easier, right? Also don't get sucked into tracking every fancy KPI just because it sounds good in meetings. Start with maybe 3-4 metrics that actually matter. Get those working smoothly first, then add more later. Trust me, trying to do everything at once will make you want to quit.
Dude, automated reporting is such a lifesaver for ISO 27001 stuff. You'll get real-time updates on compliance and risk metrics without doing any of the tedious manual work. No more pulling data by hand and screwing up spreadsheets. Your dashboard stays current, and stakeholders actually get reports they can trust. Honestly, the best part? You catch problems right away instead of finding out months later during some stressful audit. Oh, and definitely set up alerts for major compliance gaps - learned that one the hard way. Makes everything so much smoother.
Dude, get an ISO 27001 dashboard - it'll save you so much headache during audits. You can see compliance gaps in real-time instead of frantically digging through random spreadsheets (been there). Track your remediation progress and spot problem areas before auditors even show up. Monthly mini-assessments become super easy, plus it automatically generates those evidence trails auditors love. Response times, key metrics, continuous improvement stuff - it's all right there. Honestly beats the old manual way by miles. You'll never get blindsided during formal audits again.
Hey! So for ISO 27001 dashboards, most people go with the usual suspects - Power BI, Tableau, Qlik Sense. They're pretty good at handling all that compliance data stuff. Excel still shows up everywhere (yeah, I rolled my eyes too, but small teams love it). Google Data Studio works if you want something simpler. Now if you've got budget, dedicated GRC platforms like ServiceNow or MetricStream have dashboards already built in, which is nice. Honestly though? Start by figuring out what data you actually need to pull first. No point picking a fancy tool if it can't talk to your current security systems.
Set up automated feeds from your security tools and incident systems - saves you tons of manual work. Monthly reviews with stakeholders are crucial to make sure your KPIs still make sense. Honestly, I've watched so many dashboards become expensive wall art because nobody bothered updating them. Assign different sections to specific team members so there's actual accountability. Oh, and connect it to your audit tracking software too if you can. Start small though - just audit what data sources you can automate right now. The real-time updates are what'll keep people actually using the thing instead of ignoring it.
honestly the biggest win is having everything in one place instead of like 5 different dashboards that don't even connect. So much easier to spot where your ISO 27001 stuff overlaps with SOC 2 or GDPR controls - saves you from doing the same work twice which is annoying af. Your leadership team actually gets a single view of risk instead of trying to piece together random reports. Oh and gaps become way more obvious when it's all mapped out together. I'd probably start by just listing out what controls you already have, see where they overlap, then find a tool that handles multiple frameworks without being a pain to set up.
Honestly, your dashboard is basically telling you where your security's broken - you just gotta listen to it. Look for patterns in those incidents and control gaps, that's where the real problems are hiding. I always tell people the trend analysis is where you'll find the good stuff you'd totally miss otherwise. Set up monthly reviews (or whatever works) where you actually sit down with your team and turn those findings into real action plans. Don't just glance at numbers and call it done. The whole point is using what the dashboard shows to actually fix your controls and processes.
-
Great experience, I would definitely use your services further.
-
Thanks for all your great templates they have saved me lots of time and accelerate my presentations. Great product, keep them up!