





 0 Comment
 Customer Reviews

Are you finding it difficult to maintain and control the IT security of your company under continuous observation? Having a clear, visible and real-time awareness of your security status is necessary; never an option in today’s world. Here is where your most effective partner is an IT security dashboard.
A cybersecurity dashboard provides a centralized view of security indicators, from threat monitoring panels and security incident trackers to Firewall Activity Monitors and Compliance Status Trackers. These dashboards show real-time information about system imperfections, possible invasions and ongoing events, which helps IT staff make quick, smart decisions. Managing security across endpoints, networks and cloud services may be taxing without the proper visualization tools.
How SlideTeam’s Templates Simplify Security Visualization
This is where professionally created PPT templates from SlideTeam are useful. Not just aesthetically pleasing but also customisable to match your particular requirements are their ready-to-use Security Posture Dashboards, Intrusion Detection Monitors and Risk Management Dashboards.
To get going fast, review our well-chosen guide to the Top 5 Information Security Dashboard Templates.
These templates turn data into useful insights, not just perfect presentations. SlideTeam helps IT executives be one step ahead of risks and retain control with instruments, such as the IT Risk Dashboard, Identity Management Dashboards and Malware Detection Overviews.
Look through these Cybersecurity Dashboard Templates for PPT Presentations for further graphic ideas.
Let's explore !!!
Template 1: IT Security Summary with KPI Dashboard PPT Template
This slide presents a detailed IT security KPI dashboard that tracks metrics, such as Application Whitelisting, Multi-factor Verification, Backup Data and more. It shows alerts categorized by severity like High, Medium, and Low and tracks incidents within 2-hour and 24-hour windows.
This dashboard helps IT teams monitor vulnerabilities in real-time and respond faster to threats. By maintaining strong control over security metrics, organizations improve their performance, show transparency and build trust with clients through data-driven assurance.

Template 2: IT Security Budget Database Management Dashboard
This dashboard presents an overview of IT security spending and performance. It highlights budget spent, security incidents, service downtime and Mean Time to Resolve. The graph compares IT costs to revenue, while the issue tracker shows how quickly problems are resolved. This helps teams control spending, reduce downtime and improve response times. Showing results clearly, builds client confidence and proves the team is managing both risk and resources.

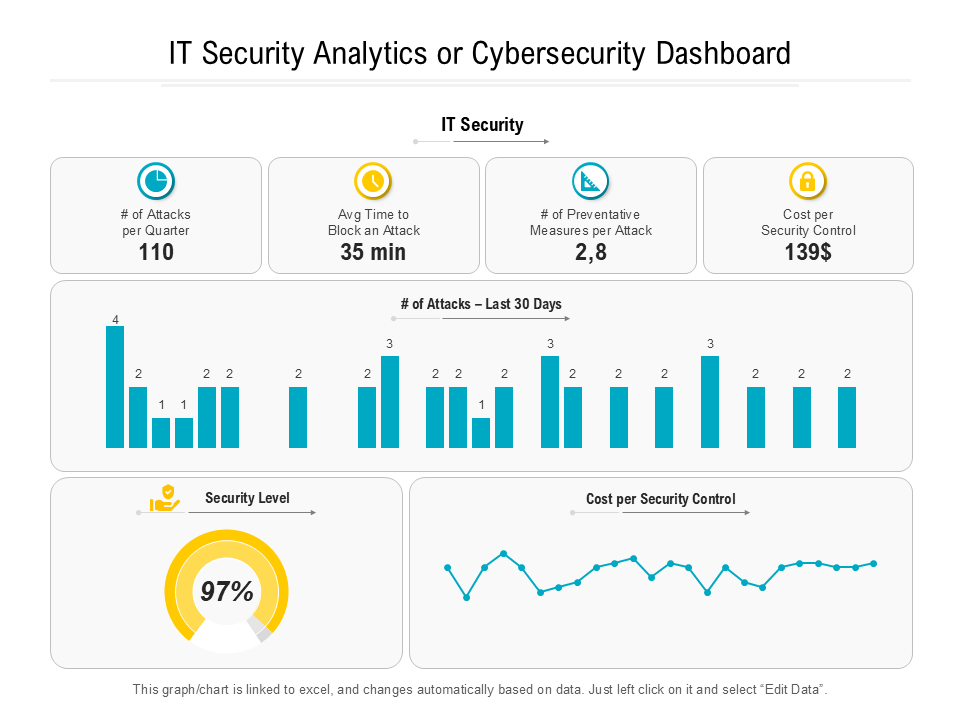
Template 3: IT Security Analytics or Cybersecurity Dashboard
This dashboard displays metrics, such as the number of cyberattacks, average block time, preventative actions and cost per security control. It also shows a 30-day attack trend and an impressive 97% security level. With these insights, IT teams can identify weak points, measure response efficiency and optimize defence strategies.
It builds client trust by showcasing data-driven security measures and cost management. Clients feel more confident knowing their data is protected by proactive, well-tracked security efforts.
Template 4: Security Dashboard of Shadow IT Services PPT Template
This slide tracks unauthorized or unmanaged IT services, showcasing 40 applications, 4 IPs and 3.5GB of traffic. It highlights risk levels (41MB), app locations and usage by service type (e.g., webmail, cloud storage). This helps IT teams identify risky or unsanctioned tools and reduce security threats. By monitoring shadow IT, teams ensure better compliance, reduce data leaks and build client trust through transparency and control—showing they actively protect sensitive information and maintain secure digital environments.

Template 5: Cyber Security Dashboard of an IT Company PPT Template
This slide showcases threats identified (1,051), average daily threats (28.7), threat trends over time and common threat types like malware and adware. It also lists devices with the most threats. This dashboard helps the team quickly detect, analyze and fix security issues. By using real-time data, the team improves protection, reduces risk and proves their ability to secure systems. This builds client trust and supports business growth through reliable cybersecurity practices.

Template 6: KPI Dashboard to Track IT Security Performance PPT Template
This slide shows the status of IT security with metrics, such as 75% progress, 25 critical risks and 234 major incidents. It tracks systems, compliance (70%), patches (80%), and threat levels. The dashboard also lists ongoing initiatives and their status. This helps teams identify weak areas, act fast on threats, and keep systems secure. By using real data, teams improve performance and gain clients' trust through transparency, security and accountability in IT operations.

Template 7: IT Security Awareness Training Executive Dashboard PPT
This slide showcases training statistics for CEO James Smith. His training completion rate is 80.33%, above the industry average. Training time is efficient at 45 minutes. The phishing rate is low (5.33%) and the email report rate is high (86.97%), both better than the average. This dashboard proves the training is effective. It helps teams improve cyber awareness, reduce risks and boost client trust by showing strong leadership commitment to cybersecurity and proactive risk management.

Template 8: IT Security Awareness Training Tracking Dashboard PowerPoint
This slide shows the progress of IT security awareness programs, including phishing attack simulations and training courses. It tracks how many are enrolled, started, in progress and completed. The graph and timeline help visualize course completions. This dashboard helps the team stay organized, track goals and improve security awareness. It builds client trust by showing a strong commitment to cybersecurity and professional development, proving the company takes data protection seriously.

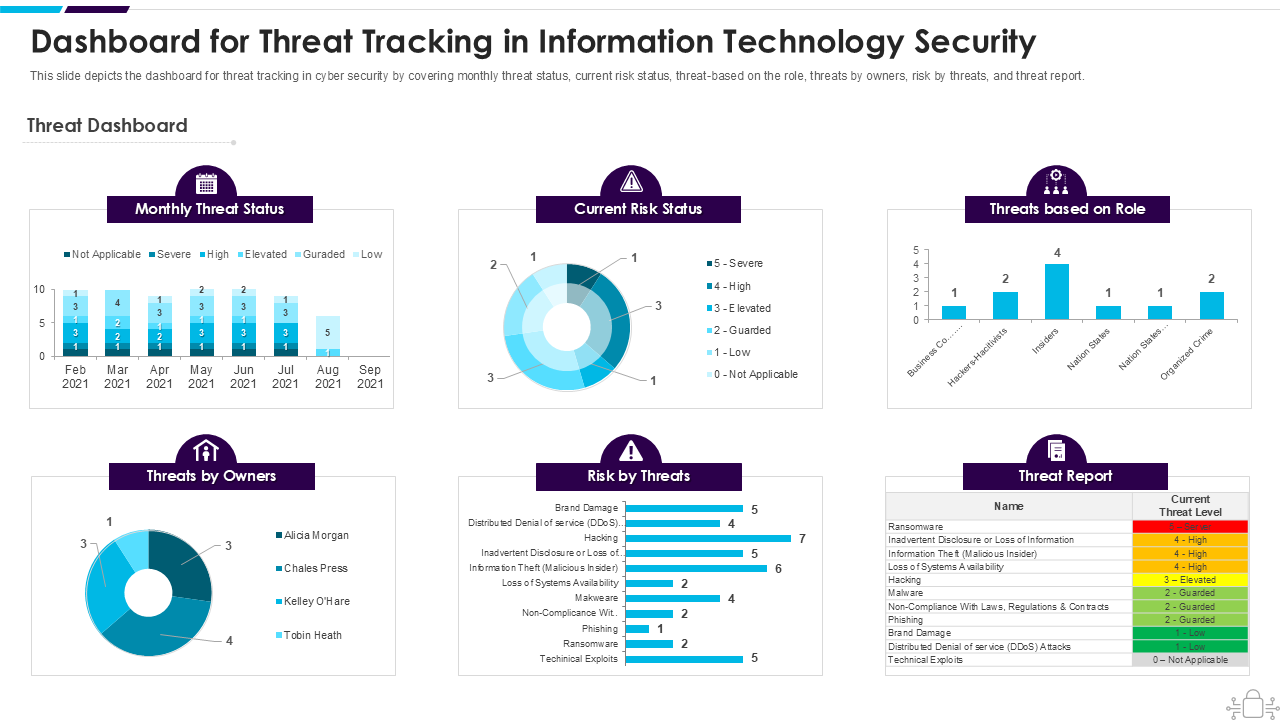
Template 9: Dashboard for Threat Tracking in Information Technology Security PPT Template
This slide showcases how cyber threats are tracked and analyzed by category, risk level, role, owner and type. It includes monthly threat trends, risk status and a detailed threat report. This dashboard helps the team spot high-risk areas, respond faster to issues and stay prepared.
By showing detailed and active threat management, it builds client trust. It proves the team takes cybersecurity seriously and protects client data with a well-organized and proactive approach.
IT Security Monitoring Cannot be Left to Chance
Using outdated spreadsheets or scattered technologies for IT security monitoring is a risk you cannot afford in today's digital world. It is important to have a clear picture of your security, whether you are in charge of Endpoint Security Panels, Data Protection Dashboards or Access Control Trackers. SlideTeam dashboards designs provide a strategic advantage in terms of simplicity, customising and aesthetically attractive effects.
PS Explore SlideTeam's blog top 5 cybersecurity risk dashboard templates for further ideas and to improve your defence plan right now.
FAQs on Security Dashboard
-
What is a security dashboard?
A security dashboard is a visual tool that collects and shows real-time information about how safe an organisation is via the web. Key performance indicators help IT and security workers keep an eye on dangers, keep track of events, evaluate risks and make sure compliance. Firewall Activity Monitors, Vulnerability Assessment Panels and Threat Monitoring Panels can all send data to dashboards that can then show it off with widgets and graphs. Teams can quickly fix problems, do good Malware Detection Overviews and easily keep an eye on the general health of the system with this centralized view. Tools like the Security Operations Center Dashboard are built specifically for such needs.
-
What are the four types of IT security?
The four primary types of IT security are:
- Network Security – Focuses on protecting infrastructure from unauthorized access, often monitored via a Network Security Overview.
- Information Security – Secures data integrity and privacy, often visualized in Data Protection Dashboards.
- Endpoint Security – Safeguards individual devices using Endpoint Security Panels.
- Application Security – Ensures apps are resistant to threats through testing and secure coding practices.
Together, these areas provide a layered defence strategy essential for a comprehensive IT Risk Dashboard setup.
-
What are the three basics of IT security?
The foundational principles of IT security, known as the CIA triad, are:
- Confidentiality – Keeping data private through Access Control Trackers and encryption.
- Integrity – Ensuring data is accurate and unaltered, monitored through Security Metrics Trackers.
- Availability – Making sure systems and data are accessible when needed, backed by resilient infrastructures.
These principles guide the creation of every effective Cybersecurity Dashboard, forming the base for policies, tools and dashboards like Compliance Status Trackers and Intrusion Detection Monitors.


