


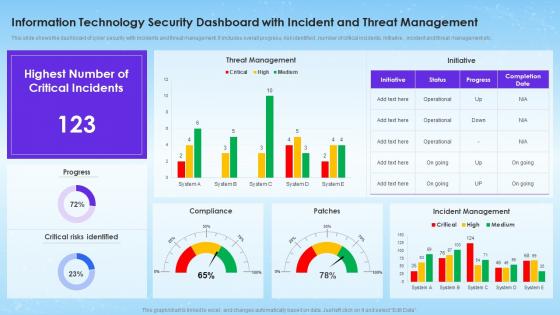
Information Technology Security Dashboard With Incident And Threat Management




Try Before you Buy Download Free Sample Product
 Impress Your
 Audience
 100%
100% Editable
 Save Hours
 of Time


This slide shows the dashboard of cyber security with incidents and threat management. It includes overall progress, risk identified , number of critical incidents, initiative , incident and threat management etc.
People who downloaded this PowerPoint presentation also viewed the following :
Information Technology Security Dashboard With Incident And Threat Management with all 7 slides:
Use our Information Technology Security Dashboard With Incident And Threat Management to effectively help you save your valuable time. They are readymade to fit into any presentation structure.





FAQs for Information Technology Security Dashboard With Incident
Focus on the big stuff first: real-time threat alerts, vulnerability tracking, and network monitoring. Incident response metrics are huge too. Oh, and definitely track user access logs - trust me on this one, it'll save your ass later when something goes sideways. For the visual side, use charts with solid color-coding so problems jump out at you. Security compliance scores should be front and center, plus any sketchy login attempts. Patch management status is boring but critical. Start with these basics, then tweak it based on what your team's actually watching every day.
Honestly, real-time dashboards are a game changer for catching security incidents fast. Instead of finding out about threats hours later through log files, you're seeing everything as it happens - live network traffic, failed logins, weird system behavior updating every few seconds. Your brain processes visual patterns way better than scrolling through endless text data too. That random spike or color change? You'll spot it instantly. Just make sure you set up alerts connected to your visualizations. Otherwise you might miss stuff when you're not actively watching the screen.
Start with vulnerability tracking - how many critical/high ones are sitting open right now. Then look at incident response times and patch compliance rates. User awareness stuff like phishing click rates will tell you if people are actually paying attention. Privileged access is huge too - seriously, half the breaches I've seen could've been prevented if someone just knew who had admin rights. Oh, and don't skip measuring if your security tools are even working. They're expensive for a reason. Build your dashboard around these basics first, you can always get fancy later.
Start with the basics - give executives what they need to scan quickly, then build in ways to dig deeper. Your main dashboard should answer "are we good?" in like 2 seconds. Honestly, I've watched so many teams create these monster dashboards that try to show everything at once. Nobody ends up using them. Stick to maybe 5-7 critical metrics on your main view. Use simple stuff like red/green indicators that actually make sense. The drill-down part is where you put all the technical details. Just make sure people can find them easily. Oh, and definitely test this with real users from different departments - what your security team loves might confuse the hell out of management.
So threat intel basically takes those generic "suspicious activity" alerts and gives you the full story. You'll see which bad actors are going after companies like yours, what methods they're using, stuff like that. Think of it as having someone scout ahead and report back before trouble hits your door. Honestly, it's a game changer for figuring out which alerts actually deserve your attention vs the noise. Plus you can tune your defenses before attacks happen instead of just reacting. I'd start with feeds that focus on your specific industry - way more relevant that way.
Honestly, Grafana + Elasticsearch is probably your best bet to start with - covers most of what you'd need. Grafana's just really solid for dashboards, and the combo handles like 80% of security monitoring stuff. Prometheus works great for infrastructure metrics too. If you need something more corporate-friendly, Tableau or Power BI are options but they're pricier. Oh, and definitely hook into threat intel APIs like VirusTotal - makes a huge difference for real-time alerts. Just make sure whatever you pick can actually handle your data load without choking. I'd honestly start simple with that Grafana setup and build from there.
Dude, get an IT security dashboard - it'll save your sanity during audits. All that compliance data gets pulled together automatically instead of you digging through like 10 different systems. Real-time reports for access controls, vulnerabilities, incident response times. The whole thing creates audit trails that prove you're hitting SOX, PCI, HIPAA requirements. You can even schedule reports to run themselves, which honestly feels like cheating but whatever works. Set up those compliance templates now before you're scrambling last minute. Trust me on this one.
Ugh, data silos are the absolute worst part. All your security tools basically refuse to play nice together - it's like they're speaking completely different languages. You'll waste so much time just trying to get them connected before you can even analyze anything useful. Then there's the data quality mess... some tools dump raw logs on you while others send processed alerts, and somehow the timestamps are always off. Plus these security tools just won't shut up - the volume is insane! Honestly though, just pick your most critical sources first and build proper connectors. Don't try tackling everything at once.
So basically, dig into your old incident reports from this past year and look for patterns. You'll probably find some wild trends you didn't expect. Historical data shows you which vulnerabilities attackers love hitting, when your systems are most vulnerable, and how threats change over time. Way better than guessing, honestly. This stuff helps you figure out where to spend your security budget and which patches to prioritize. Plus you can spot those recurring weak spots that keep causing headaches - those need real fixes, not just temporary patches. Perfect timing to map out your 2024 security strategy too.
Ugh, the worst thing you can do is cram everything onto one screen - people just shut down. Match your metrics to who's actually looking at them, you know? Like don't show executives technical alerts they can't do anything about. SOC analysts need real-time stuff, not those pretty trend charts that are basically useless wallpaper. I've seen so many dashboards that just look impressive but don't help anyone make decisions. Stick to maybe 5-7 metrics tops. Each one should actually drive some action, and definitely test it with real users first - saves you from looking like an idiot later.
So basically you'll want to hook up your UBA tools to the dashboard using APIs or data feeds. Splunk and Elastic are pretty solid for pulling in stuff like anomaly scores and risk ratings in real-time. Honestly though, the hardest part isn't the technical setup - it's not drowning in all the data these tools throw at you. I'd stick with maybe 3-4 key things: high-risk user scores, weird login patterns, and data access that looks off compared to normal behavior. Trust me, you don't want your dashboard turning into some overwhelming mess that nobody actually checks.
The "5-second rule" is your best friend here - users need to get the main points immediately. Put your biggest security alerts right at the top, then group similar stuff together. Stick with simple colors: red = bad, green = good. Don't cram everything into one space either, white space actually helps people focus. Your charts should make sense without needing a manual to decode them (I've seen some truly terrible ones). Test it with real people and see what they notice first - you'll be surprised where their attention goes.
Honestly, dashboards are a game-changer for getting execs to actually pay attention to security stuff. You know how they hate wading through those massive technical reports? Well, dashboards fix that by showing everything visually - think red/green status lights and simple charts they can scan in like 30 seconds. The trick is making different versions for different people. Your security team gets the nitty-gritty details, while the C-suite gets the high-level "here's what you need to know" version. Just figure out what metrics your leadership actually cares about first, then build around that.
So basically you want to show people only what matters for their job, right? SOC analysts need those real-time alerts and incident stuff front and center. Executives just want the big picture - risk metrics, compliance status, that kind of thing. IT managers are tricky though - they need the overview but also want to dig deeper when shit hits the fan. Honestly, it saves so much time when people aren't clicking through random dashboards that don't even apply to them. Just figure out what each role actually does every day, then build around that. Trust me, your team will thank you.
Cloud stuff totally changes the security dashboard game. Your old on-premise setup? Pretty much useless now. Everything's constantly spinning up and down, spread across different regions and services - it's honestly a nightmare to track sometimes. You'll need dashboards that can pull logs from containers, serverless functions, all that auto-scaling madness in real-time. The data volume is insane compared to what we used to deal with. Focus on cloud-native integrations that actually work with this chaos. Oh, and make sure whatever you pick can handle the speed these systems throw data at you.
-
The way SlideTeam professionals work is exceptional. Thanks for being so helpful!
-
Love the template collection they have! I have prepared for my meetings much faster without worrying about designing a whole presentation from scratch.