


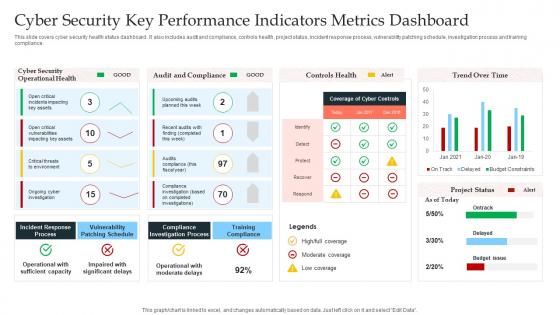
Cyber Security Key Performance Indicators Metrics Dashboard




Try Before you Buy Download Free Sample Product
 Impress Your
 Audience
 100%
100% Editable
 Save Hours
 of Time


This slide covers cyber security health status dashboard . It also includes audit and compliance, controls health, project status, incident response process, vulnerability patching schedule, investigation process and training compliance.
People who downloaded this PowerPoint presentation also viewed the following :
Cyber Security Key Performance Indicators Metrics Dashboard with all 7 slides:
Use our Cyber Security Key Performance Indicators Metrics Dashboard to effectively help you save your valuable time. They are readymade to fit into any presentation structure.





FAQs for Cyber Security Key Performance
Start with MTTD and MTTR - basically how fast you catch threats and respond to them. Incident frequency matters too. Vulnerability remediation rates are honestly brutal to look at, but they'll show you if your security program actually works or if it's just theater. Track phishing sim results since people will always click weird links (sorry, not sorry). Oh, and don't go overboard initially. Get these basics down first, then you can add fancier metrics once you've got solid data to compare against.
Honestly, you gotta figure out what keeps your executives up at night first - losing money, pissed off customers, systems going down. Map your security stuff to those fears. Don't just count how many vulnerabilities you patched (boring). Show them how quick patching prevents costly outages. Track things like how fast you catch threats on critical systems, incidents that actually hurt business operations, or compliance scores that could tank customer deals. I learned this the hard way - nobody in leadership cares about your technical wins unless you translate them into dollars and business impact.
Your cybersecurity team's reaction speed matters way more than people realize. Quick detection and containment = way less damage to your systems. Track your mean time to detection (MTTD) and mean time to containment (MTTC) - these'll show if you're actually getting better or just spinning wheels. Some incidents need instant response, others can wait a few hours depending on severity. Industry benchmarks help but honestly, consistency in measuring is what really counts. Once you've got solid data flowing, trends become obvious and you'll spot exactly where your process is breaking down.
So you'll want to track a few key things. Phishing simulation click rates are huge - if they drop from like 30% to 5% over six months, you're golden. Also measure how quickly people report sketchy emails compared to before training. Completion rates for modules matter too, obviously. Monthly tracking works best so you can tweak things as you go. The patterns become super obvious pretty fast - you'll spot which departments are struggling or what topics confuse everyone. Oh, and don't forget incident reports from employees themselves. Real data beats guessing every time.
Start with detection rates and false positives - you want to catch real threats without your system going nuts over nothing. MTTD and MTTR matter too since you can't afford to sit around when something's actually wrong. Coverage metrics show if you're protecting everything or missing spots. Don't get sucked into tracking stuff that just looks good on paper but doesn't help. I've seen teams obsess over metrics that sound impressive but tell you nothing useful. Focus on escalation rates and whether your automated responses actually work. Pick maybe 3-4 things that tie directly to keeping you secure instead of measuring every possible thing.
Look at your mean time to patch first - that's how long vulns sit before you actually fix them. Vulnerability aging is huge too, especially anything critical that's been hanging around 30+ days (honestly, that's when I start panicking). Track your patch success rates and how big your backlog gets. The real winner though? Seeing if you're getting fewer repeat vulns each month - that tells you if people are actually learning. Set up monthly dashboards for this stuff and you'll catch problems way faster. Oh, and don't forget remediation rates by severity level.
When presenting to execs, skip the tech talk completely. They want to hear about risk reduction, breach costs, and compliance - not patch counts. Use red/yellow/green visuals on your dashboard. Honestly, anything more than 3-5 metrics and they'll tune out fast. Always connect your numbers back to business impact and show trends over time. If something looks bad, you better have an action plan ready. The trick is translating everything into dollars and business continuity speak. Trust me, executives don't care how elegant your security architecture is - they care if it keeps the company running and profitable.
Real-time monitoring completely flips the script on KPIs. You can finally track stuff like mean time to detection and incident response times since data's coming in live. Without it? You're basically looking in the rearview mirror while threats are hitting right now. The analytics part is game-changing too - automated alerts and anomaly detection happen as events unfold. Focus on KPIs that actually let you take immediate action instead of just filling monthly reports. Honestly, backward-looking metrics feel pretty useless when you're dealing with active incidents. Figure out which current KPIs would benefit from real-time data first.
Honestly, finding good industry benchmarks for cybersecurity KPIs is kind of a mess right now. Ponemon Institute and Verizon's DBIR have decent data, but they don't always slice it by industry in helpful ways. Healthcare obviously tracks different stuff because of HIPAA, while finance has their own regulatory nightmare to deal with. Your best move? Join those industry security groups where companies actually share real numbers - that's where the good intel is. Also check what regulations hit your sector since those usually drive the KPIs that actually matter. IBM's breach reports are solid too, just saying.
Track your KPIs consistently - that's where the patterns show up. Look at incident frequency, attack vectors, detection times, stuff like that. Don't just check weekly though, you'll miss the bigger picture. I'd set up dashboards showing 3-6 months so you can actually see if phishing's getting worse or your response times are improving. Also - and this saved us before - automate alerts when metrics hit certain levels. You don't want to catch a trend two months too late. Regular review meetings help too, but honestly the automated part does most of the heavy lifting.
Honestly, most cyber KPIs are pretty useless because they just tell you what already happened. Like counting how many incidents you fixed last month - cool, but what about the attack happening right now? The worst part is when companies brag about patching 95% of systems but ignore that the remaining 5% might be their most critical stuff. These old-school metrics can't keep up with how fast threats change anyway. Oh, and they're awful at showing actual business impact too. You really need to start looking at predictive stuff instead - threat intelligence, behavioral patterns, that kind of thing. Way more helpful than playing catch-up.
So quantitative KPIs are basically your hard data - stuff like how long it takes to detect incidents, vulnerabilities you've patched, training completion rates. Easy to track and compare. Qualitative ones are trickier. They measure things like how well your incident response actually works or whether people are happy with security policies. Way harder to put numbers on, but honestly? They tell you more about whether your security is actually solid. You really need both though - quantitative gives you the facts, qualitative tells you if you're doing it right.
So user behavior analytics is basically your foundation for solid cybersecurity KPIs. It shows you what normal looks like so you can actually spot the weird stuff - login anomalies, sketchy data access, privilege escalations that don't make sense. Without that baseline, you're just throwing random security metrics at the wall and hoping something sticks (which, let's be honest, never works). Pick your top 3-5 user behaviors that actually matter for your security setup. Then build KPIs around those patterns. Way more effective than generic metrics that don't tell you if you're getting better at catching real threats.
Track how many vendors actually finish their security assessments first - that's your baseline. Then measure how fast you fix critical audit findings and count any third-party incidents (hopefully zero, but let's be real). Compliance rates matter too - are vendors following your security rules? Here's what always gets overlooked: how quickly can you cut off access when contracts end? I've seen companies mess this up constantly. Don't go overboard tracking everything though. Pick 3-4 solid metrics that show you're catching risks early AND responding well when stuff goes sideways.
RTO and RPO are basically your speed limits for disaster recovery - RTO is how fast you bounce back from incidents, RPO is how much data you're willing to lose. Honestly, they're lifesavers when the C-suite freaks out about costs. You can actually prove your team's getting better at response times instead of just saying "trust me, we're improving." Plus they help justify why you need that expensive backup system or whatever. Track them consistently and you'll have real numbers to show gaps in your processes. Way better than guessing if your incident response actually works.
-
“The presentation template I got from you was a very useful one.My presentation went very well and the comments were positive.Thank you for the support. Kudos to the team!”
-
Excellent Designs.