Internal Audit KPI Analysis Dashboard

Rating:
90%
Internal Audit KPI Analysis Dashboard
Slide 1 of 7
Favourites Favourites

Try Before you Buy Download Free Sample Product

Audience Impress Your
Audience
Editable 100%
Editable
Time Save Hours
of Time
The Biggest Sale is ending soon in
0
0
:
0
0
:
0
0
Rating:
90%
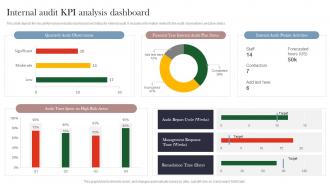
This slide depicts the key performance indicator dashboard and status for internal audit. It includes information related to the audit observations and plan status. Introducing our Internal Audit KPI Analysis Dashboard set of slides. The topics discussed in these slides are Audit Report Cycle, Management Response, Remediation Time. This is an immediately available PowerPoint presentation that can be conveniently customized. Download it and convince your audience.

People who downloaded this PowerPoint presentation also viewed the following :

FAQs for Internal Audit

I'd go with audit cycle time (planning to final report), percentage of audits finished on schedule, and cost per audit hour. Resource utilization rates help too - basically how much time you're spending on actual valuable work vs admin stuff. Don't get sucked into vanity metrics though, they'll just mess with your head. Track stakeholder satisfaction scores and how many of your recommendations actually get implemented. Quality matters as much as speed. Honestly, just pick 3-4 KPIs that tackle your team's biggest pain points first. You can always add more to your dashboard later once you've got those dialed in.

Honestly, you've gotta figure out what actually keeps your executives up at night - revenue, customer complaints, whatever. Then build your audit metrics around that stuff instead of boring counts like "audits completed." If they're obsessed with cutting costs, track how much money your recommendations save. Show them you're preventing real losses or fixing processes that matter to customers. The whole "number of findings" thing? Leadership doesn't care about that at all. I'd sit down with the business heads every few months to make sure you're still measuring things they actually value. It's way more work upfront but makes your team look essential instead of just... there.

Look, numbers only tell half the story. Sure, you can track whether audits got done on time, but what about stakeholder satisfaction? Are people actually implementing your recommendations or just filing them away? That's the stuff that really matters. Survey your audit clients regularly - find out if they think your work adds value. Track how often management accepts your findings. I've seen teams nail every deadline but produce work that sits on shelves collecting dust. Honestly, I'd rather miss a deadline and deliver something impactful. The qualitative feedback shows whether you're making a real difference or just going through the motions.

Oh dude, this is a game changer! You know how we're always drowning in spreadsheets trying to pull audit numbers? Skip all that. Get some audit management software that grabs your KPIs automatically - completion rates, resolution times, all that stuff. Real-time dashboards are honestly pretty sweet because you can catch problems early instead of scrambling later. Your stakeholders won't bug you for updates since they can check the data whenever. I'd start small though - pick whatever you're tracking manually now and automate just those first. Way less headache.

So the main ones you want are audit finding closure rates, how fast you fix critical stuff, and repeat findings - that last one's gold because it shows if people actually learn or just slap fixes on things. Also track your regulatory exam trends and control test failures. Oh, and compliance coverage ratio is pretty solid too - basically what percentage of requirements you're hitting each cycle. Honestly though, focus on the metrics that show real improvement over time instead of just snapshots. The repeat findings thing drives me crazy when orgs don't track it properly.

Think of KPIs as your canary in the coal mine - they'll catch problems way before they blow up on you. Track stuff like how long audits take, repeat findings, and how slow people are implementing recommendations. When those numbers creep up, something's broken. Maybe it's resources, maybe stakeholders are being difficult (honestly, it's usually stakeholders). Exception reports are gold too - they show which departments are always messy. I'd set up monthly dashboards to watch for trends. Once you spot patterns, dig into the why and tweak your process.

Honestly, the hardest part is setting targets that sound good to management but won't crush your team. Resource constraints are real - you can't audit everything perfectly and fast. Plus measuring quality is a nightmare. Like, how do you track "insights that actually catch fraud" versus just churning out reports? Leadership always wants everything yesterday while keeping the same thoroughness (good luck with that). Every audit is different too, so those cookie-cutter benchmarks from other companies? Pretty useless. Start small - pick maybe 3 metrics you can actually control. Track them for a quarter, see what happens. You'll probably realize your initial capacity estimates were way off anyway.

Look, tie your KPIs straight to whatever your org's actually focused on right now. Review them yearly minimum - or whenever big changes hit. I swear, half the audit teams I know are still tracking metrics from like 2019 that mean absolutely nothing anymore. Set up quarterly calls with your audit committee and senior folks to double-check you're measuring what they actually care about. Benchmark against peers too so you don't miss obvious stuff. Honestly, the biggest mistake is treating KPIs like they're carved in stone instead of updating them when your world changes.

You really need to get stakeholder feedback on your KPIs - it's a total game changer. Management and business units will tell you what metrics actually matter vs the ones that just sound impressive. I've watched teams completely flip their approach after learning stakeholders cared way more about how fast audits got done than how many issues they found. Honestly, most of us are measuring the wrong stuff without realizing it. Set up quarterly check-ins and straight up ask which KPIs help them make decisions. You'll be shocked at what you discover.

Yeah, audit KPIs are totally different depending on your industry. Finance companies obsess over compliance rates and regulatory findings - makes sense since they're breathing down their necks constantly. Healthcare? They're all about patient safety metrics and HIPAA stuff because one breach and you're screwed. Manufacturing focuses more on operational efficiency and safety incidents. It's pretty logical when you think about it - each industry worries about different nightmares. Banks fear regulators, hospitals fear lawsuits, factories fear shutdowns. Start with whatever keeps your executives up at night, then build your KPIs around those risks instead of copying some generic framework online.

Start with implementation rates - that's honestly your most important metric. What percentage of recommendations actually happen within your deadlines? Also check management acceptance rates, since constant pushback usually means your suggestions are either unrealistic or you're not explaining them well. Time from recommendation to completion matters too (nobody wants things dragging on forever). Keep an eye on repeat findings - same problems showing up audit after audit means nothing's really changing. Oh, and try to put dollar amounts on risk reduction or cost savings when you can. Makes everything more concrete.

Looking at what your competitors track shows you what you might be missing. Maybe they're all measuring audit cycle time and you aren't, or they focus on risk coverage metrics you've totally ignored. It's like peeking at the smart kid's test answers, honestly. You'll get concrete targets instead of just winging it and hoping your numbers are decent. Industry surveys and annual reports are gold mines for this stuff - that's where I'd start digging. Just seeing what "good" actually looks like in your field makes a huge difference when you're trying to figure out if your KPI setup is on point.

Okay so internal audit KPIs are actually pretty smart - they stop departments from ignoring your findings and hoping you'll forget about them. Track stuff like how fast teams fix issues and whether the same problems keep popping up. Share those numbers with leadership monthly (or whatever works). Trust me, nobody wants their team looking bad on the scorecard. You'll start seeing patterns in the data that help catch bigger issues early. I'd say pick maybe 4-5 metrics that your stakeholders actually care about and automate the whole thing so you're not stuck doing manual reports forever.

Okay so three things work really well with execs. Start with business impact - turn your audit stuff into actual dollar amounts or risk levels they get. Visual dashboards are your friend here, especially those red/yellow/green systems (they eat that up for some reason). Don't just throw numbers at them though. Tell it like a story: "We found this, it means X for the business, here's our fix." Keep it tight but make sense of it all. Oh and always have a one-page summary ready - they'll reference it later when they can't remember the details from your presentation.

Set up a dashboard mixing hard data with the softer stuff - you'll want audit completion rates and resolution times alongside stakeholder satisfaction surveys. I'd weight it 60/40 quantitative to qualitative, though that really depends on how mature your org is. The qualitative feedback is honestly where you find the gold if you track it consistently. Pick maybe 2-3 metrics from each bucket to start. Don't go overboard initially - you can always tweak things quarterly based on what actually matters to your stakeholders. Oh, and document everything so you can spot patterns later.

Ratings and Reviews

90% of 100
Review Form
Write a review
Most Relevant Reviews
  1. 80%

    by Cruz Hayes

    Awesome presentation, really professional and easy to edit.
  2. 100%

    by Dustin Perkins

    Informative presentations that are easily editable.

2 Item(s)

per page: