


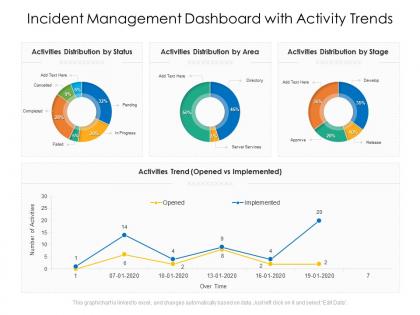
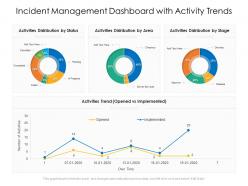
Incident management dashboard snapshot with activity trends




Try Before you Buy Download Free Sample Product
 Impress Your
 Audience
 100%
100% Editable
 Save Hours
 of Time


Our Incident Management Dashboard Snapshot With Activity Trends are topically designed to provide an attractive backdrop to any subject. Use them to look like a presentation pro.
People who downloaded this PowerPoint presentation also viewed the following :
Incident management dashboard snapshot with activity trends with all 2 slides:
Use our Incident Management Dashboard Snapshot With Activity Trends to effectively help you save your valuable time. They are readymade to fit into any presentation structure.

FAQs for Incident management dashboard snapshot
So for your incident dashboard, definitely include real-time status updates and priority levels - that's like the bare minimum. Assignment tracking and SLA timers are crucial too. I'd also throw in escalation paths and communication logs where everyone can see them. Oh, and resolution metrics! Honestly, trend analysis is where it gets interesting because you start seeing patterns you'd never notice otherwise. Stakeholder notifications and post-incident reviews should be tracked somewhere visible too. The whole point is having everything right there so your team can instantly see what's on fire vs what's chill. Start basic, then tweak it based on what actually gets used.
Dude, real-time data viz is a game changer for incident response. You'll spot issues instantly instead of hunting through endless logs like some digital detective. Your brain processes visual patterns way faster than text alerts - it's wild how much quicker you can grasp what's broken and how badly. The whole team gets aligned on scope immediately too. Honestly, once you have those automated alerts firing off your dashboards, you'll wonder how you ever survived without it. Oh and definitely tie everything to severity levels so you're not chasing false alarms.
So I'd track four main things. Mean Time to Resolution shows how fast you're actually fixing stuff. First Call Resolution Rate is huge - tells you if people need to call back multiple times, which honestly drives everyone crazy. Customer satisfaction scores give you the real deal on whether you solved their problem or just closed the ticket. Escalation rates matter too since tons of escalations usually mean your initial sorting process sucks. Pull these weekly and you'll start seeing patterns pretty quick. MTTR is probably the easiest one to start with if you're feeling overwhelmed.
Honestly, these dashboards are game-changers for keeping everyone in the loop. Instead of digging through random Slack threads (ugh), your whole team can see what's happening right now in one spot. Who's handling what, status updates, chat logs - it's all there. Updates sync automatically so nobody's working off old info. The best part? People can collaborate directly in the incident records and tag whoever needs to jump in. Oh, and definitely set up notifications for the critical stuff - trust me on that one. Creates way less chaos when things go sideways.
Dude, looking at your historical data is like having a time machine for incidents. You'll spot patterns that would totally fly under the radar otherwise - which problems pop up most, timing trends, typical resolution speeds. The dashboard visualization makes it way less painful to dig through everything. I'd start with your last quarter's data because you'll probably find some weird patterns that'll actually help shape your strategy. Once you see the trends, you can tweak staffing when needed and update those runbooks for the stuff that keeps breaking. Honestly, it's pretty satisfying when you start predicting issues before they blow up.
Honestly, customizable dashboards are a game changer because each team can focus on their own stuff without getting buried in random metrics. NOC guys want alerts and system status. Management wants the big picture trends and SLA numbers. Think of it like everyone having their own radio station they actually want to listen to. You can drag widgets around, set who sees what, and build views that don't suck for daily work. I'd start small though - pick one team for a pilot, see which widgets they actually use, then expand from there.
Honestly, API compatibility is gonna be your biggest pain. Your current tools probably won't mesh well with whatever data format the dashboard uses. Field names never match up - it's like they do it on purpose. Performance can tank too if you're pulling from tons of sources at once. Oh, and security teams? They'll freak out about new integrations and slow everything down with approvals. Legacy systems are the absolute worst for this stuff. I'd start small - pick your most important tool, get that working first, then build from there once you figure out what breaks.
So basically, ML can look at your old incident data and actually predict when stuff's gonna break next. Time patterns, system load, recent deployments - it analyzes all that to give you heads up before things go sideways. Way smarter than scrambling after the fact. Plus it'll rank incidents by potential damage and even suggest who should handle what based on how fast they've fixed similar issues before. Honestly, some of these newer dashboard tools have pretty solid forecasting built in now. I'd start by figuring out your most frequent incident types first, then see what your current vendor offers.
Start with colors that make sense - red for the bad stuff, green when things are fixed. Your most critical incidents need to pop immediately because nobody wants to dig around when everything's breaking. Clean layout is key, with your main metrics right up front. Real-time updates are a must, plus good filtering so teams can find their specific fires quickly. Oh, and definitely test it on mobile - I learned that one the hard way when I couldn't check status from my phone. Run it by your actual incident response folks before you launch anything though.
Honestly, the color-coded priority matrices are a game changer. Red stuff = drop everything, green = whenever you get around to it. Way better than digging through ticket lists all day. Most dashboards let you filter by business units too, which is clutch when you're trying to focus on the stuff that actually matters. Oh, and set up those automated alerts for the critical combos - trust me on this one. You don't want to be the person who missed something huge because it got buried. The visual aspect just makes everything click faster.
Look, most dashboards run React or Angular up front, then Node.js, Python, or Spring Boot on the backend. PostgreSQL handles the data stuff, Redis keeps things snappy. But here's the thing - your tech stack doesn't matter nearly as much as playing nice with whatever monitoring tools you're already stuck with. Grafana and PagerDuty have decent pre-built options if you don't want to reinvent the wheel. Building from scratch? Focus on websockets for real-time updates and don't screw up the API design. Nothing's worse than alerts that show up five minutes late.
So dashboards are honestly a lifesaver for compliance stuff. They automatically track all your response times, SLA metrics, and resolution rates - basically everything auditors want to see. Real-time visibility is huge too. The best part? No more pulling data from like 15 different systems when it's report time (seriously, who has time for that). Everything gets documented with audit trails showing who touched what and when. I'd say start by figuring out which compliance metrics actually matter for your industry, then set up your dashboard to track those KPIs automatically. Makes the whole process way less painful.
Dude, mobile access is clutch for remote teams. Your people can jump on incidents immediately instead of waiting until they're back at their desks - super important when you've got folks in different time zones. I actually love being able to check system health while I'm out getting lunch instead of constantly stressing about what's broken. Real-time alerts hit your phone, you can escalate stuff right away, and everyone can collaborate through comments. Just make sure your whole team downloads the app and sets up notifications properly or things will slip through.
Start with access control - only let the right people see sensitive incident stuff through role-based permissions. Encrypt everything (transit and at rest) since you're dealing with security incidents that could be super confidential. API authentication is huge too - I got burned on this once lol. Data masking for any PII helps a ton. Audit logging tracks who looked at what. Make sure it aligns with compliance reqs your org has. Honestly, I'd do a security review of what you have now first and tackle the worst gaps. Short sentences work better than trying to fix everything at once.
Customer feedback shows you what's *actually* breaking for people, not just what your dashboards claim. Sometimes a tiny UI glitch will have users screaming while that "critical" database hiccup? Nobody even notices. You can prioritize fixes based on real impact instead of guessing. Plus feedback reveals patterns your monitoring totally misses - and honestly, it's the only way to know if you've actually fixed something from their perspective. Just automate the feedback collection in your incident process so you don't forget to ask when things get crazy.
-
Very unique, user-friendly presentation interface.
-
Good research work and creative work done on every template.
-
It saves your time and decrease your efforts in half.