Security Dashboard To Identify The Risk Of Application

Rating:
100%
Security Dashboard To Identify The Risk Of Application
Slide 1 of 7

or

Favourites Favourites

Try Before you Buy Download Free Sample Product

Audience Impress Your
Audience
Editable 100%
Editable
Time Save Hours
of Time
The Biggest Sale is ending soon in
0
0
:
0
0
:
0
0
Rating:
100%
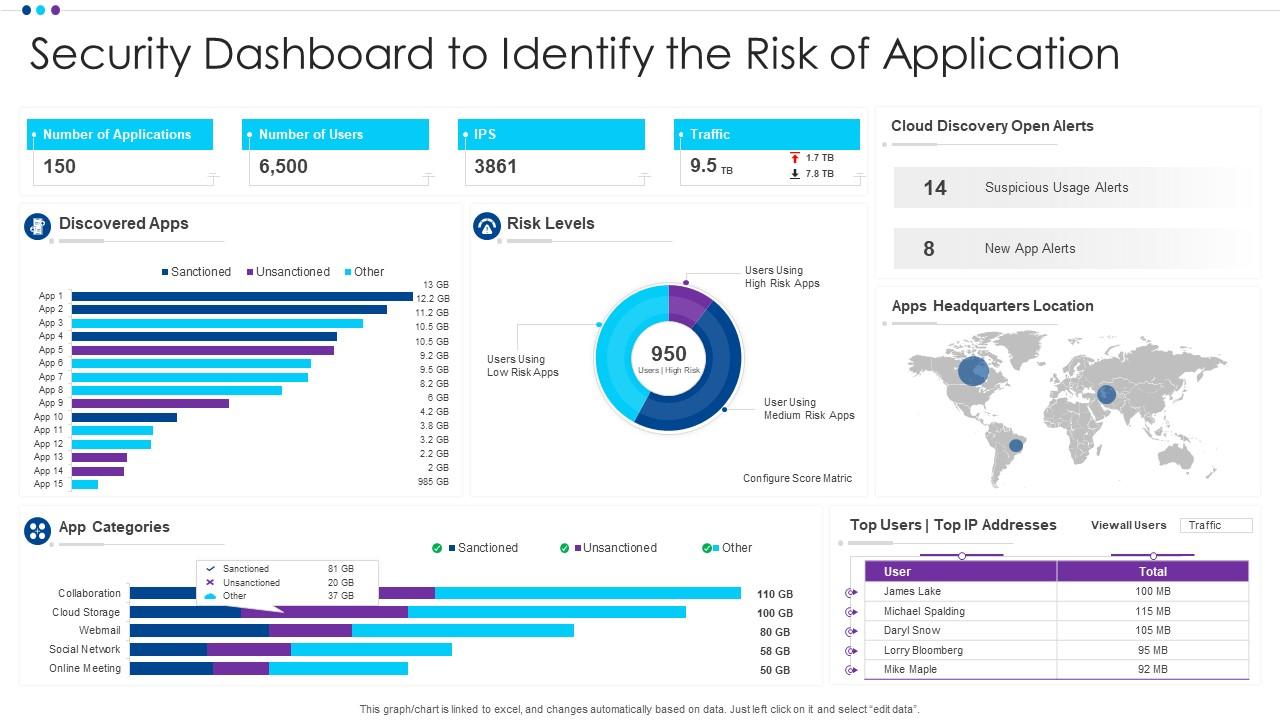
Introducing our Security Dashboard To Identify The Risk Of Application set of slides. The topics discussed in these slides are App Categories, Discovered Apps, Risk Levels. This is an immediately available PowerPoint presentation that can be conveniently customized. Download it and convince your audience.

FAQs for Security Dashboard To Identify The

Start with real-time threat monitoring and vulnerability tracking - that's your bread and butter. Incident response metrics are huge too. You definitely want compliance indicators that stakeholders can actually understand, not some confusing risk score nobody gets. Asset inventory should show everything at a glance. User access analytics help catch weird behavior before it becomes a problem. Honestly, half the dashboards I see are just pretty charts with useless data. Make sure yours updates automatically and breaks info into chunks people can digest. Add custom stuff later based on what your team's actually looking at every day.

Honestly, real-time visualization is a game changer for catching threats as they happen instead of finding out about them way too late. You'll see those failed login spikes instantly, weird traffic patterns, sketchy user behavior - all of it mapped out visually across your whole setup. Way better than drowning in log files (which, let's be real, nobody wants to do). Your brain just processes visual stuff faster than text dumps. I'd set up some automated visual alerts for your most critical stuff - that way nothing slips by when you're not actively watching.

Honestly, start with incident response times and how fast you're patching vulnerabilities - that stuff will bite you if you ignore it. User behavior is huge too. I'd track login failures and sketchy privileged access attempts. Your security training completion rates matter more than people think (users are simultaneously your worst nightmare and best asset). Oh, and whatever compliance boxes you need to check - obviously. Don't go crazy tracking fifty different things though. Pick maybe 5-7 metrics that actually relate to what worries you most about your specific setup. Build from there once you've got the basics down.

So ML basically watches your network 24/7 and learns what "normal" looks like for your systems. When something weird happens, it flags it way faster than humans could catch it. I'd start with your most important stuff first - don't try to do everything at once or you'll go crazy. The smart part is how it connects dots between random events to spot those sneaky multi-step attacks. Plus it gets better at filtering out the fake alarms over time, so you're not constantly chasing false positives. Honestly saves tons of headache once it's dialed in.

Honestly, UX can make or break your security dashboard. When incidents hit, analysts need to spot critical alerts immediately - no hunting through messy interfaces or trying to decode weird charts. I've seen teams miss real threats because their dashboard was a confusing mess. The best ones put urgent stuff front and center with clean layouts that actually match how security folks work when they're stressed. Short bursts of info work better than walls of data. If your team can't glance at it and instantly know what's wrong, you're setting them up to fail when it matters most.

So here's what I'd do - figure out what each group actually needs to see first. Executives want the big picture stuff: risk scores, compliance status, maybe some pretty charts for board meetings. Security teams are totally different though - they're digging into threat data and incident details all day. IT ops people? They basically live and breathe system health metrics and vuln counts. I'd start mapping out what decisions these folks make daily, then build dashboards around that. Give execs their automated summary reports (they love those), but your analysts need the interactive stuff where they can click around and investigate. Different roles, different views - keeps everyone happy.

First thing - get your data formats normalized or you'll hate yourself later. Pick the sources that actually matter for decisions, not every random tool you have (seriously, I've seen teams go overboard and regret it). Use proper APIs instead of scraping when you can. Real-time feeds work great for urgent alerts, but batch the rest. You want one source of truth that people actually believe in. Oh, and definitely test everything twice - have backup plans because integrations love to break at 2am.

Honestly, most security dashboards are a hot mess - way too much blinking and not enough actual info. Start with your critical stuff first, then use simple colors like red/yellow/green so people get it instantly. Group similar issues together instead of listing every tiny thing separately. Each alert needs someone assigned to it with clear next steps. I always tell people: if you woke up at 2am to this alert, would you know what the hell to do? Test it with your team first - they'll catch the confusing bits you missed.

Start with NIST Cybersecurity Framework - it's the gold standard with five core functions that work perfectly as dashboard sections. ISO 27001 works great if your company is big on compliance stuff. For threat-focused dashboards, MITRE ATT&CK breaks down real adversary tactics really well. CIS Controls might actually be your best bet though since they're super practical and actionable. I'd go with whatever matches your current security setup and use it to organize your dashboard sections. Oh, and don't overthink the KPI mapping - that part usually falls into place once you pick a framework.

So automation basically handles all the boring stuff that usually drives you crazy - sorting alerts, figuring out which ones actually matter, sending them to whoever needs to deal with it. The cool part is it can automatically kick off response actions too, like cutting off sketchy network traffic or quarantining infected machines. No more drowning in false alarms, which honestly was the worst part of my old job. I'd start small though - pick your most annoying repetitive tasks first. Once your team's used to it, you can build fancier automated workflows. Trust me, it'll save your sanity.

Honestly, the worst thing you can do is throw every metric you have onto one screen. Total information overload. Teams also get obsessed with vanity metrics that look cool but won't actually help you make decisions. Building the same dashboard for your SOC team and C-suite? Yeah, that's gonna backfire hard. Bad data quality will destroy everything faster than you think too. My advice: pick 3-5 metrics that actually connect to what you're trying to accomplish security-wise. Get those right first, then you can always add more later.

Honestly, just overlay those threat intel feeds directly onto your current security data. Map IoCs against network traffic, flag sketchy domains in DNS logs, highlight bad IPs in firewall events. Trust me - don't try manual correlation, it's absolutely brutal. Get your SIEM to auto-enrich security events with threat intel so analysts can instantly spot if that random connection is from a known APT group. Oh, and start with one solid commercial feed first. I know free ones are tempting, but you'll go crazy trying to manage multiple feeds right off the bat.

So you definitely need something that tracks SOX, PCI-DSS, HIPAA - whatever applies to you - in real time. Risk scoring and vulnerability tracking are must-haves. The audit trail stuff is huge since auditors basically live for organized documentation. Don't sleep on access controls and user monitoring either. Automated alerts saved my butt so many times when deadlines snuck up. Oh, and make sure it plays nice with your current security tools - nobody wants to pull data from like five different places every quarter. That's just painful. Customizable reporting for on-demand compliance reports rounds it out nicely.

So basically these dashboards take all that crazy technical security stuff and turn it into visuals that everyone can actually read. No more IT people throwing around scan results that make business teams want to hide under their desks. You get charts showing both the business impact AND the techy details - so when you're trying to explain why some patch needs to happen NOW, executives see potential money loss while IT sees the severity scores. Honestly, it's like magic for those awkward cross-team meetings. Just set up different views for each team so they only see what matters to them.

Dude, you absolutely need real-time alerts. Catching incidents as they happen vs hours later? Totally different game. Ten minutes can literally be the difference between stopping an attack and dealing with a complete mess. Configure different severity levels so you're not getting pinged every five seconds for random stuff, but you'll definitely know when shit hits the fan. Just don't go crazy with the thresholds or you'll end up ignoring everything - learned that one the hard way. Your team needs that instant heads up to actually respond fast enough.

Ratings and Reviews

100% of 100
Review Form
Write a review
Most Relevant Reviews
  1. 100%

    by Dusty Hoffman

    Great product with effective design. Helped a lot in our corporate presentations. Easy to edit and stunning visuals.
  2. 100%

    by Don Hansen

    The templates you provide are great! They have saved me tons of time and made my presentations come alive. Thank you for this awesome product. Keep up the good work!

2 Item(s)

per page: