


Cyber security dashboard snapshot for security operations powerpoint template




Try Before you Buy Download Free Sample Product
 Impress Your
 Audience
 100%
100% Editable
 Save Hours
 of Time


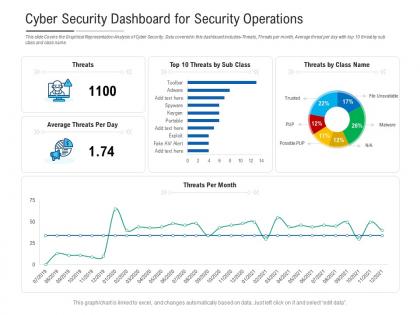
For a specified/measured time period, an effective security dashboard snapshot should include the following: An indicator of the organization's present threat level; an indication of events and occurrences that have happened; a record of authentication problems; an indication of scans, probes, and unwanted access, as well as a signal indicating whether those key measures are up, down, or unchanged; Brute force assaults on the system and non-compliant devices; policy breaches; malware incidents; and phishing incidents. The cyber security dashboard template provides an overview of all the important aspects of your security operation in one place. You can quickly and easily see what is happening on your network, where vulnerabilities exist, and how well your defenses are holding up. Download our cyber security PowerPoint templates now to get started building your own dashboard. With this tool at your fingertips, you’ll be able to keep track of your organization’s cybersecurity posture with ease.
People who downloaded this PowerPoint presentation also viewed the following :
Cyber security dashboard snapshot for security operations powerpoint template with all 2 slides:
Use our Cyber Security Dashboard Snapshot For Security Operations Powerpoint Template to effectively help you save your valuable time. They are readymade to fit into any presentation structure.
FAQs for Cyber security dashboard snapshot for security
So for your security dashboard, start with threat detection rates and response times - that's the bread and butter stuff. Vulnerability counts matter too, especially sorted by severity. Oh, and definitely track those weird login patterns because honestly, that's where most of the sketchy stuff shows up first. Network traffic anomalies are clutch. Patch management status if you're into that (which you should be). Maybe compliance scores depending on your situation? Don't go crazy though - stick to like 6-8 metrics tops or nobody's gonna actually look at it. You can always add more later once people get used to checking it daily.
Honestly, visualization is a game changer for cybersecurity data. Your brain picks up visual patterns way faster than sifting through endless text logs - like comparing a map to a phone book, you know? Heat maps show you where attacks are clustering, trend lines reveal how threats develop over time. Color-coded alerts literally jump out at you instead of getting buried in walls of text. You'll catch anomalies quicker and actually be able to explain risks to your boss without their eyes glazing over. Pro tip though - start simple with basic charts before going crazy with fancy dashboards.
Dude, you absolutely need real-time data for cybersecurity dashboards. Think about it - would you rather catch hackers while they're breaking in or find out next week? Live feeds let you block attacks immediately, isolate infected systems, shut things down fast. Yesterday's data is basically worthless when someone's actively trying to mess with your network. The whole point is responding quickly enough to actually stop damage from happening. Oh, and make sure your refresh rate isn't like every hour or something ridiculous - that defeats the purpose. You want to see threats as they're happening, not after they've already wrecked everything.
First thing - figure out what threats actually hit your industry. Healthcare gets slammed with ransomware, so track those metrics. Financial services? Focus on fraud detection stuff. Most dashboard tools let you customize widgets pretty easily. I've seen teams do some smart things pulling in threat feeds for their specific sector. Honestly, compliance frameworks are huge here - HIPAA, PCI-DSS, whatever applies to you. Build your KPIs around those. Don't go crazy at first though. Pick like 3-4 industry-specific metrics and grow from there.
Dude, filter your feeds first - match them to your actual environment and assets. Don't be like most teams who dump everything into their dashboard and wonder why it's useless noise. Focus on indicators that can actually trigger responses or give your SOC clear actions to take. Your intel sources better be reliable and current, plus include context like confidence levels and TTPs. Oh and honestly? Raw intel is pretty worthless unless you're turning it into something your team can act on fast. The whole point is making decisions, not just collecting data.
So for user behavior stuff, heat maps are perfect - they'll show you login patterns and when people are most active. Color-coded risk scores make it super easy to spot weird behavior (red usually means trouble, obviously). Trend graphs comparing normal vs current activity are clutch too. Oh, and definitely set up alert panels for sketchy stuff like late-night logins or massive downloads. Honestly, starting with just these basics will give you a pretty solid view of what your users are up to. You can always add more fancy charts later if you need them.
Honestly, Splunk's the best but it'll drain your budget super quick. For cheaper options, check out Grafana with Prometheus - works great if you're not swimming in cash. IBM QRadar and Microsoft Sentinel are solid for SIEM stuff. Oh, and if you're presenting to the C-suite, they love Tableau's flashy charts. Elastic Stack is decent too. My advice? Figure out what data you actually need first. Then just pick whatever plays nice with your current setup. We made the mistake of going fancy before mapping our sources - don't be us lol.
So here's the thing - your dashboard needs to match where your team actually is with security stuff. Basic orgs should stick to simple metrics like patch status and antivirus coverage. Don't overwhelm people who are still figuring things out. Advanced teams can handle threat intelligence feeds and behavioral analytics, which honestly gets pretty complex fast. I've watched so many dashboards crash and burn because they tried cramming everything in at once. Start simple. Your team will tell you when they're ready for more sophisticated features, trust me.
Oh man, that constantly shifting threat data is the worst part - like you're always one step behind. Different tools throwing conflicting formats at you makes integration a total mess. And don't even get me started on false positives... nothing tanks your credibility faster than those "urgent" alerts that are basically nothing. Your legacy systems probably hate talking to newer security tools too. Set up some automated validation rules if you can. Oh, and have someone eyeball the weird stuff weekly - catches problems before they spiral. Honestly saved my butt more than once.
So basically you'll want to connect your security tools directly to the dashboard through their APIs - stuff like your SIEM, vulnerability scanners, endpoint detection. Most have decent API documentation (though some are honestly terrible to work with). Schedule automatic pulls every few hours or daily depending on what makes sense. Don't go crazy at first - pick maybe 3-4 key metrics and build from there. Trust me, you can easily overwhelm yourself with too much data. Set up some basic alerts for weird spikes or drops so you're not just looking at pretty charts all day. Start with whatever keeps your boss happy, then expand once that's running smooth.
Honestly, cybersecurity dashboards are pretty solid for catching stuff before it hits you hard. You'll spot weird login attempts, sketchy file access, network weirdness - basically all the red flags that scream "something's up." Real-time alerts are clutch for shutting down threats fast. Like, you can block compromised accounts or isolate infected systems before they spread. The key is actually using the thing though - I see so many people set it up then never check it. Daily monitoring makes all the difference between catching malware early versus dealing with a full breach later.
Honestly, you'll get way better results when different teams actually talk to each other about your dashboard. IT sees technical stuff, but finance might spot weird payment patterns that screams "breach." HR catches suspicious login attempts from their angle. Makes sense, right? Each department knows what red flags matter in their world vs. just random noise. I'd set up monthly meetings where everyone can share what they're seeing - sounds boring but it actually helps you figure out which alerts are worth panicking over. Multiple perspectives = better threat detection.
Honestly, cloud dashboards are pretty solid for security monitoring. Your team can check threats from anywhere instead of being tied to the office. No server maintenance headaches either - the vendor deals with all that boring infrastructure stuff. Pricing's way more predictable too, just monthly fees instead of dropping huge money upfront. The integrations work surprisingly well with most security tools, which is nice because custom setups are the worst. Auto backups are included, plus you get enterprise-grade security without building it from scratch. I'd probably test a couple different ones first though - some interfaces are just clunky.
Oh man, cybersecurity dashboards are honestly a game-changer for compliance stuff. You know how awful it is pulling data from like 15 different tools when auditors show up? This fixes that. Everything's in one spot - incident response times, vulnerability fixes, access controls, all that regulatory nonsense. The audit trail gets built automatically which is huge. I learned this the hard way at my last job lol. Set up those automated reports for whatever frameworks you need (SOC 2, HIPAA, etc.) and you'll actually be ready instead of scrambling.
Honestly, start with three main groups: SOC analysts (they're in the weeds with real-time alerts), security managers who care about metrics and how their team's doing, and execs who just want to know "are we screwed or not?" Don't forget IT admins - they're usually the ones actually fixing stuff when alerts go off. The data needs are totally different though. Analysts want every technical detail you can give them. Managers need the operational stuff. Executives? Keep it simple and high-level. I'd definitely interview people from each group first to see what actually makes their job harder.
-
Unique design & color.
-
Qualitative and comprehensive slides.
-
Amazing product with appealing content and design.
-
Out of the box and creative design.
-
Excellent products for quick understanding.
-
Understandable and informative presentation.
-
Appreciate the research and its presentable format.