

 Customer Reviews
Money makes the world go round. Finance as a business discipline makes sure you have more of it. A financial dashboard is where you visualize your efforts at ensuring your finances are in order.
Yet, we find that financial dashboards are not exactly flying off the shelves. This indicates a gap in your processes that you are well advised to bridge quickly. This is even as financial professionals and departments are under more pressure than ever to provide timely insights as well as clear and reliable financial reports. A company can quickly comprehend and measure all data accurately and in real time with the use of financial dashboards. These allow finance professionals to validate figures faster and drill down into monetary details as needed. The result is increased productivity and a stable financial environment.
Dashboards have also emerged as indispensable tools of financial management. However, many organizations are unsure about including financial dashboards as a tool for financial management. Dashboards, on the other hand, are what you need to energize your business operations if financial reporting is tedious and time-consuming or an administrative headache.
SlideTeam offers you the perfect solution to your financial accounting woes and brings you Finance Dashboard PPT Templates to ease your workload. Check these out now!
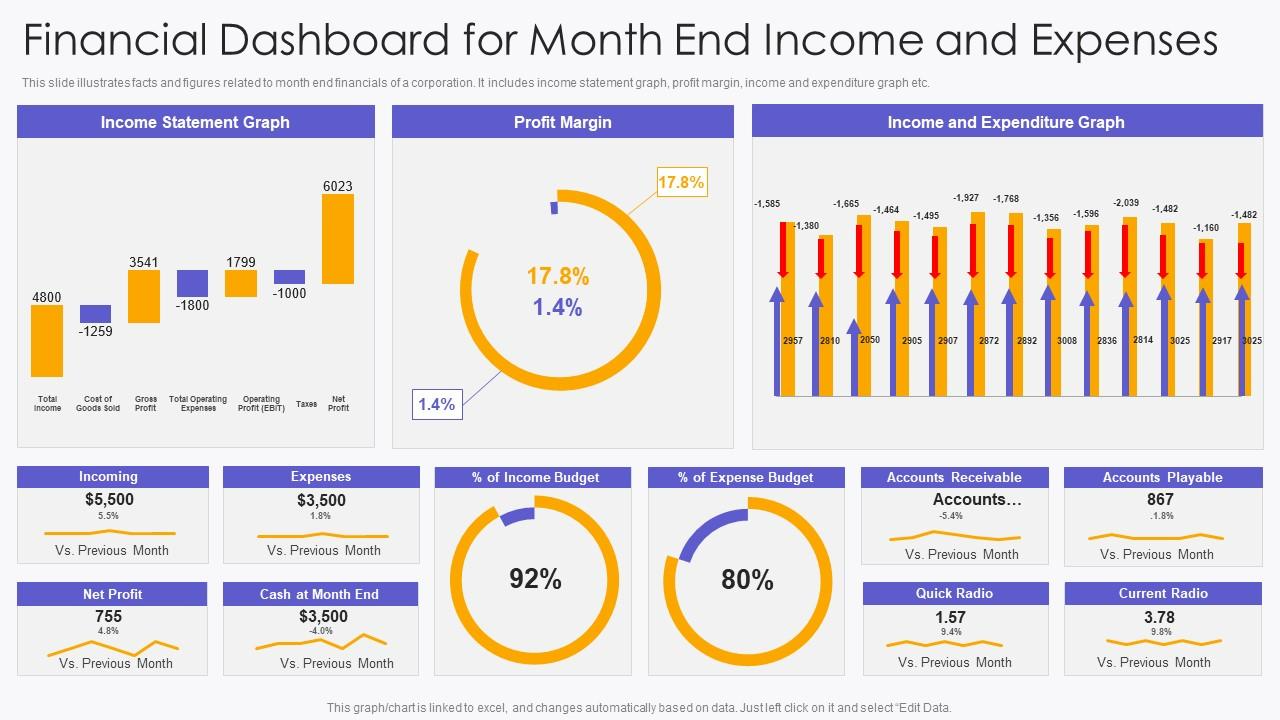
Template 1: Finance Dashboard For Month-End Income and Expenses
This finance dashboard PPT Template provides you with an overview of all your month-end income and expenses. The income statement graph, profit margin, income, and expenditure graph help you with accurate numbers and data to avoid confusion. Use this template to emerge as a business pro with the listing of your accounts receivable and accounts payable. Get this design now!
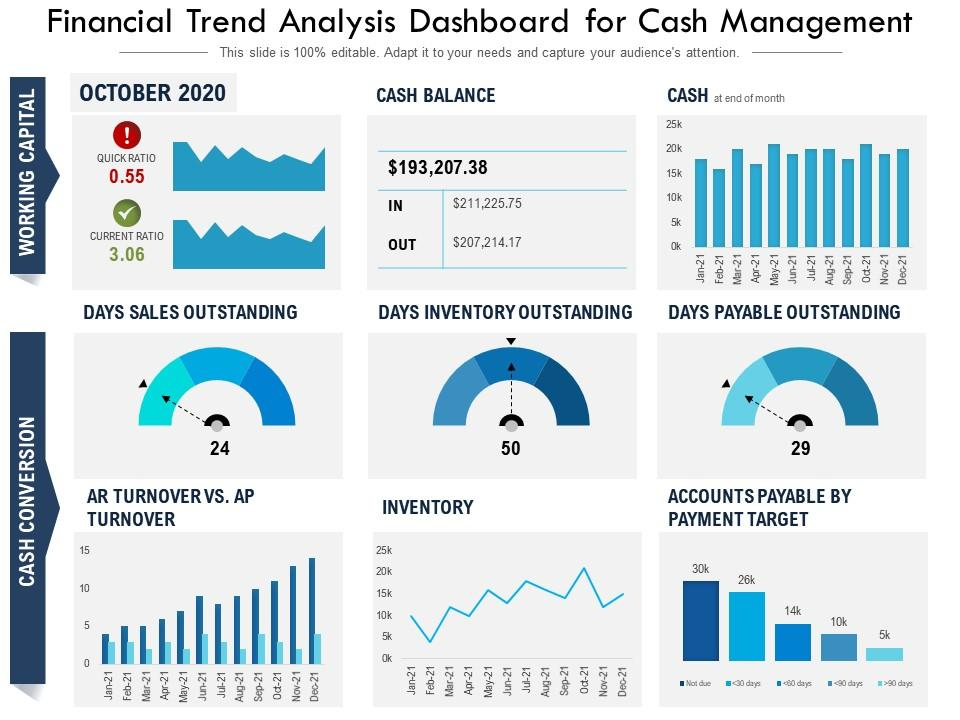
Template 2: Financial Trend Analysis Dashboard For Cash Management
Easily locate how your business is placed in terms of liquidity with this cash management financial dashboard. Working capital and cash conversion are also highlighted in this slide to assist you with the current cash balance, sales outstanding, turnover, inventory, and so on. Understand and forecast your company’s long-term direction with the download of this template.
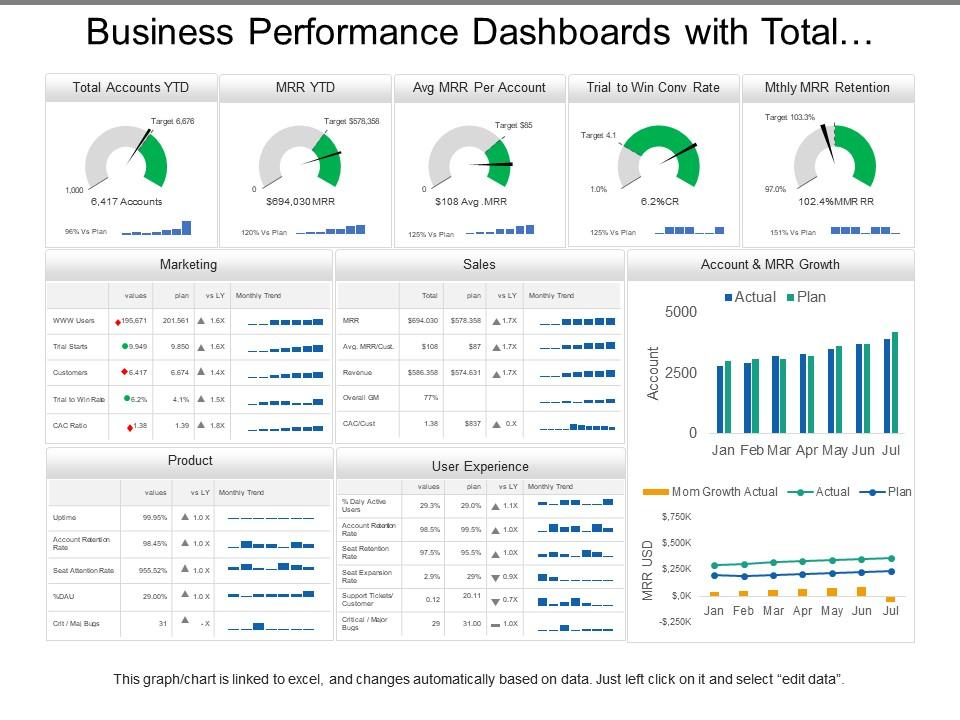
Template 3: Business Financial Performance Dashboard With Total Accounts Marketing
Use this PPT Template to demonstrate the viability of your plans, the company's expansion to purchase new assets, and to motivate your coworkers to do better. This slide emphasizes accounts related to marketing, sales, user experience, etc. With this presentation template, you have the chance to judge and analyze performance across departments, be it marketing, sales, or user experience of products. Grab this design instantly!
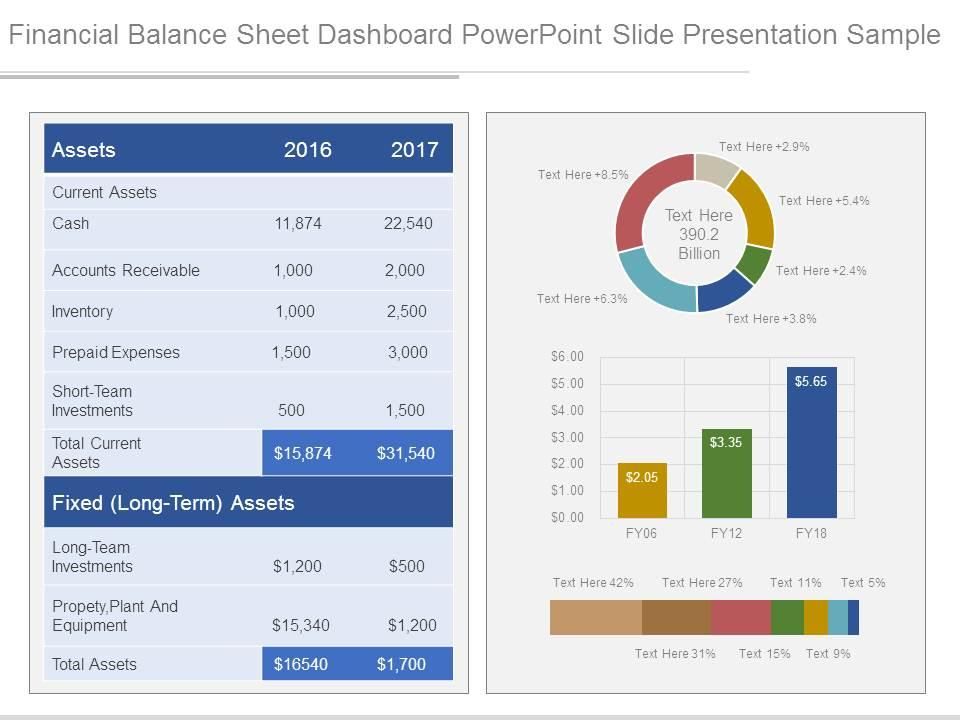
Template 4: Financial Balance Sheet Dashboard PPT Template
A balance sheet calculates equity, which is the value of your business after debts and liabilities have been paid. Your assets and liabilities are listed on this balance sheet dashboard template with both long-term and short-term demarcated. Knowing this information is critical for keeping your company's finances in order. To keep things simple, this layout will assist you in easily managing your numbers. It's an excellent starting point for creating your first balance sheet. You can use the color codes to provide a snapshot of your financial health to your stakeholders and investors. Get it right away!
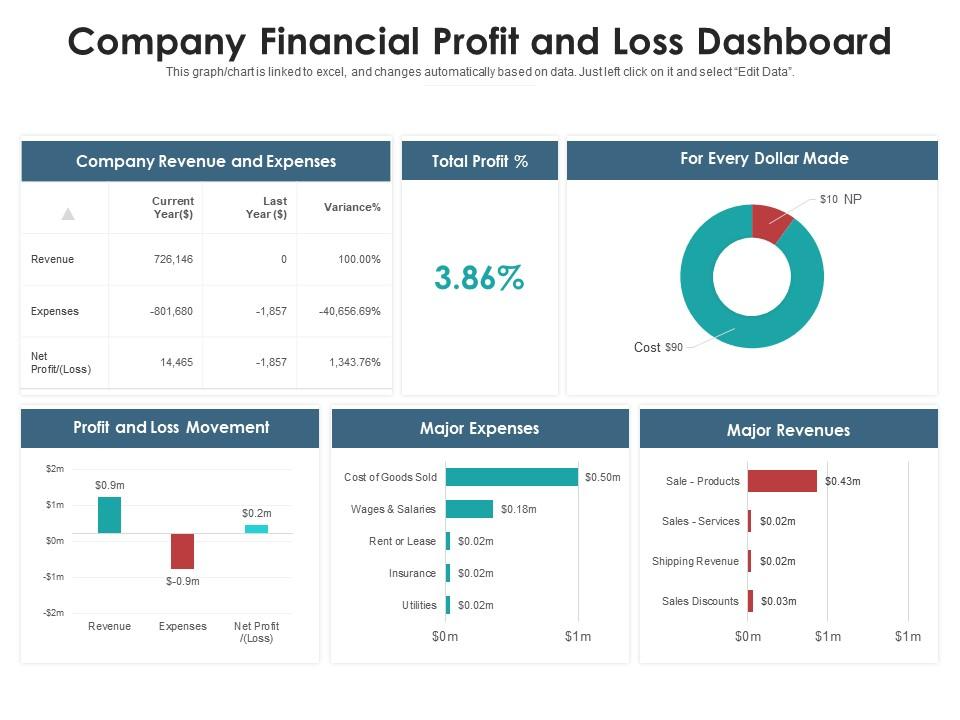
Template 5: Company Financial Profit and Loss Dashboard
A profit and loss statement is a financial statement that totals revenue, costs, and expenses over a given time period. With our company financial dashboard PPT Template, gain an insight into major expenses, revenues, and so on to know the focus areas. Time to turn all the losses into profits. See how your profit and loss have moved over a specified period with this template in real-time to decide whether the top management needs to intervene. Download this design now!
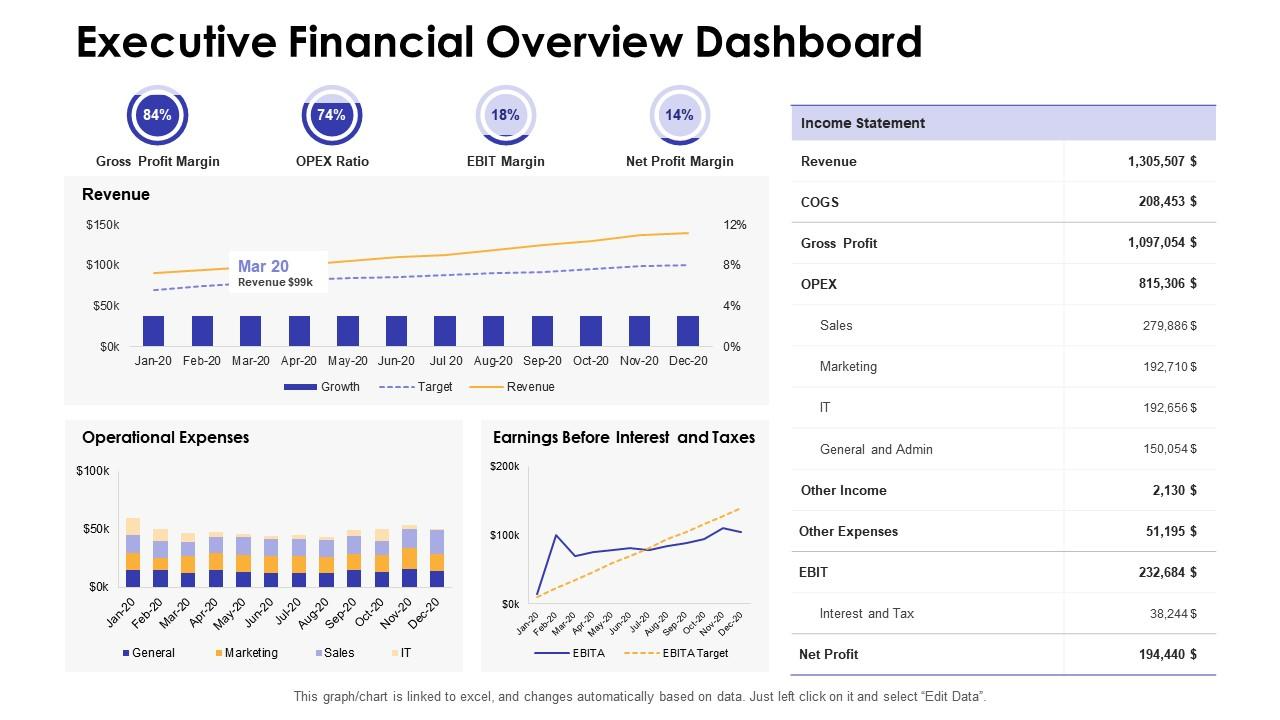
Template 6: Executive Finance Overview Dashboard PPT Template
With our template, you can aid your organization in analyzing and explaining financial performance, as well as comparing it to historical data. Have your income statement, revenue, operational expenses, etc., ready for further action. Easy to edit, this theme is a must-have for top management. Tabulate your operational expenses and EBITA to stay informed of the efficiency of your operations. Get it now!
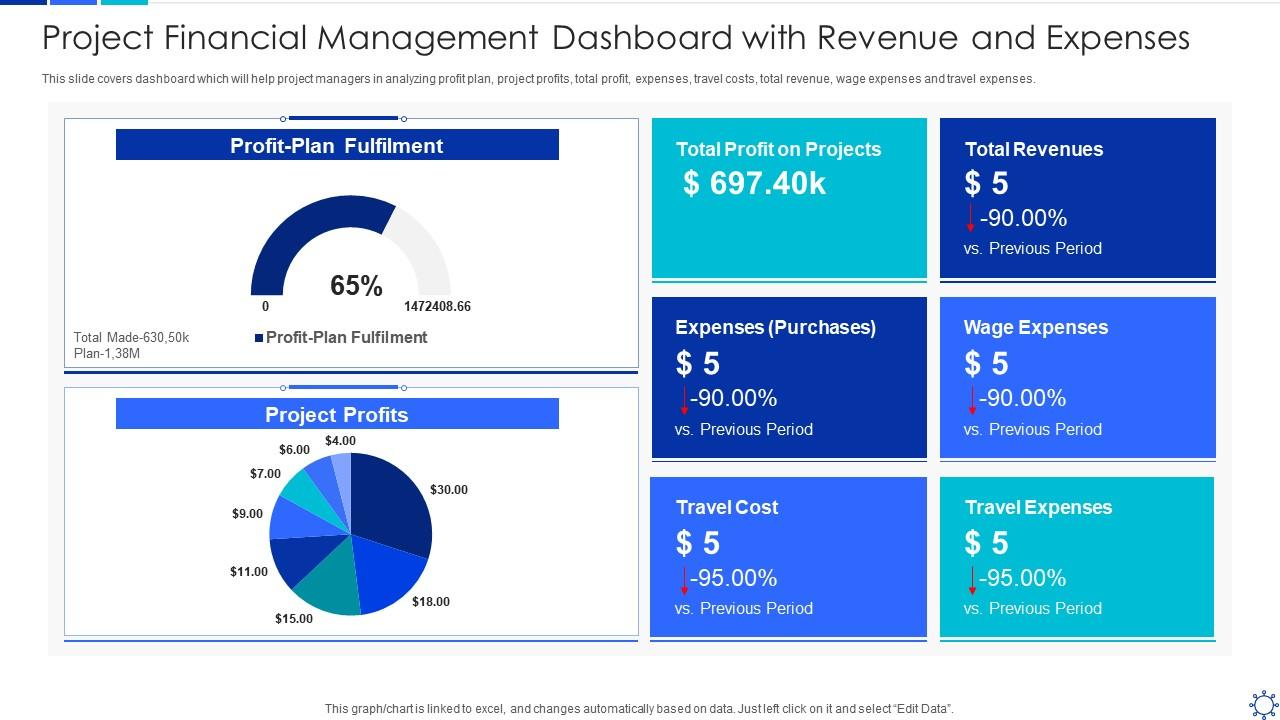
Template 7: Project Financial Management Dashboard With Revenue and Expenses
Managing a project’s financial aspects is of utmost importance to carry out all the activities efficiently. Our project finance management dashboard PPT Template assists you with authentic data related to the revenue and expenses of the organization. Convenient to customize, this slide helps you sort out the initial stage of financial management. Track total revenues and total profits on projects as major decision points. Get it now!
Template 8: Financial Performance Tracking Dashboard PPT Template
Analyze the complete financial health of your company with the help of our financial performance tracking dashboard PPT Template. Learn and track how well your company is performing in terms of monetary stability. This template displays the number of customers, vendors, revenues generated, expenses and profit incurred, etc. Compare revenues and expenses side-by-side with our innovatively designed bar graph. Grab this design right now!
![]()
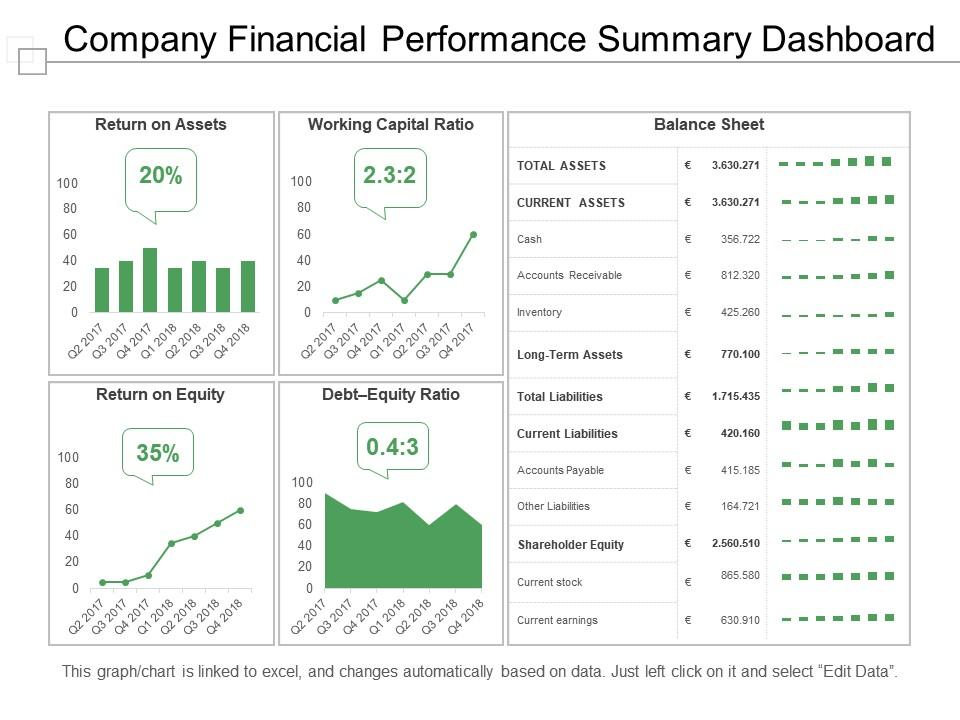
Template 9: Company Financial Performance Summary Dashboard PPT Template
Incorporate this slide and demonstrate your company's financial strength. It will aid in effectively communicating your financial capabilities. It will also serve as an effective management information tool that a company can use to represent its position. You can even use this ready-to-use PPT Template to represent the company's profitability ratios and financial statements graphically. Use this presentation template to have four financial ratios at your fingertips. These are- return on assets, working capital ratio, return on equity, and debt-equity ratio. Get it now!
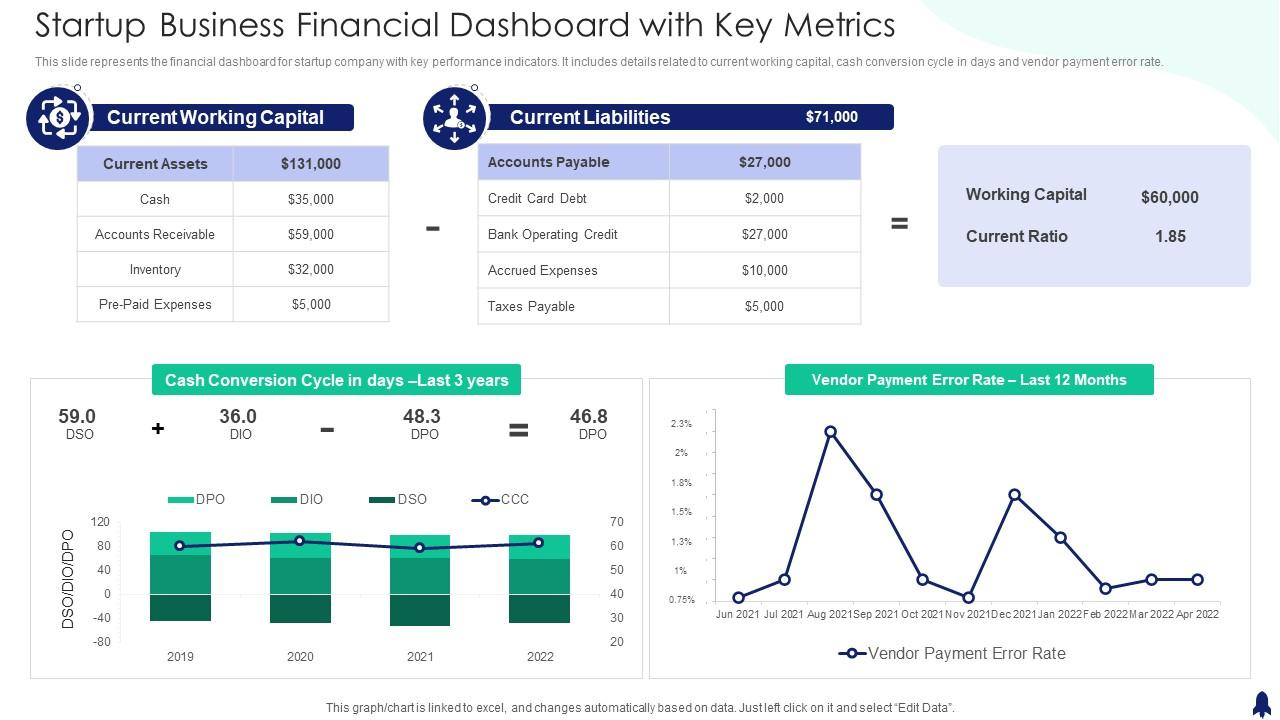
Template 10: Startup Business Finance Dashboard With Key Metrics
It can be difficult to break into an industry, so it's critical that no key performance data points are neglected. Dashboards come into play here. This financial dashboard can monitor KPIs in relation to predefined goals. These KPIs can be useful in financial reporting or when making critical decisions. As a new entrant to the business world, you need to be extra vigilant to ensure you make a name for yourself. Use this template to highlight your current working capital and current liabilities- also, be aware of your cash conversion cycle. Deploy this slide now!
All in All
Suppose financial reporting feels like an administrative, terrifying exercise at your company. In that case, a dashboard may be just what you need to make a better decision involving your company’s money or how you use cash.
With a financial dashboard PPT Template, your company can create rich data points that everyone in the organization can use. This system provides complete integration of financial and non-financial data, allowing you always to know the real-time pulse of your company's financial performance.
P.S- Wish to forecast and set finances for your company? Our PPT Templates will help you create a financial plan, forecast future finances, and set a budget in order to make decisions that are in the best interest of a company.
FAQs On Finance Dashboard
What are the metrics that every financial dashboard should include?
The metrics you include in your financial dashboard will be determined by your company's goals and target audience. That being said, we've outlined a few metrics that are a great place to start when tracking your company's performance.
1- Total customer base and demographics
2- Product, month, or salesperson net profit
3- Capital for working purposes
4- Trends in revenue and expenses
5- Profit margin from operations
6- Complete asset turnover
What is a KPI Dashboard?
KPI dashboards are tools that combine data sources and provide instant visual feedback on how your company performs in relation to key performance indicators (KPIs). You'll have everything you need in one place if you build your KPI dashboard with the same tool or platform you use to define your KPIs. When you change your KPI definitions, data sources, or targets, the changes are automatically reflected in your dashboards, saving you time and effort.
How do you build a financial dashboard?
You have a powerful tool in your hands when you create a dashboard that provides an effective overview of your fiscal performance. Continue reading to learn how to create a dashboard in just a few steps.
Step 1: Determine your objectives.
Step 2: Select which metrics should be included.
Step 3: Monitor and report performance.
Step 4: Make a chart.
Step 5: Establish the frequency of data insertion.
What do you mean by a CFO Dashboard?
A CFO dashboard is a digital display tool that keeps everything visible and all financial data in one place. It includes company cash flow, revenue, and financial risk data, among other things. Some software applications even provide personalized insights and analysis.
Financial dashboards have traditionally been difficult to set up. At the start of any new financial system, inputting the original data, creating rules, and deciphering the original patterns is time-consuming. However, once everything is in place, there should be little to no learning curve.