


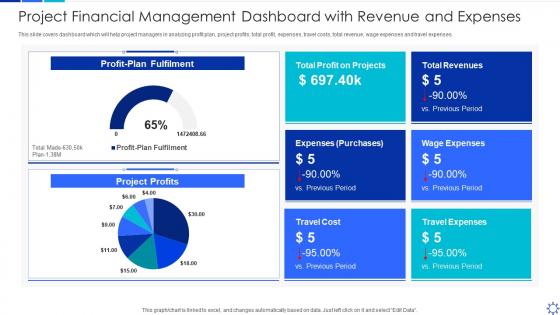
Project financial management dashboard with revenue and expenses




Try Before you Buy Download Free Sample Product
 Impress Your
 Audience
 100%
100% Editable
 Save Hours
 of Time


Our Project Financial Management Dashboard With Revenue And Expenses are topically designed to provide an attractive backdrop to any subject. Use them to look like a presentation pro.
People who downloaded this PowerPoint presentation also viewed the following :
Project financial management dashboard with revenue and expenses with all 7 slides:
Use our Project Financial Management Dashboard With Revenue And Expenses to effectively help you save your valuable time. They are readymade to fit into any presentation structure.





FAQs for Project financial management dashboard with
Honestly, start with the basics - budget vs actual spend and your burn rate. Those two will tell you most of what you need to know. Throw in cost variance and schedule performance index because they're actually useful for quick health checks. Don't forget committed costs though - that's the stuff you've approved but haven't paid yet, and it always sneaks up on people. If it's billable, track revenue recognition and margins obviously. Cash flow projections are clutch too. Nobody wants to have that "oops we're broke" conversation with the boss. Build from there based on what your team actually cares about.
Oh man, you definitely need one of these. Real-time budget tracking beats the hell out of waiting for monthly reports that are already useless by the time you see them. You'll catch cost overruns before they wreck everything, plus you can shift money between different parts of your project on the fly. Way better than wrestling with spreadsheets all day - trust me on that one. The live data lets you pivot fast when things go sideways. Just pick your top 3 money metrics first and build from there.
Honestly, Power BI and Tableau are your best bet if you need fancy visuals and multiple data connections. Excel's still legit for smaller stuff - I don't care what the tech bros say. Google Data Studio is perfect if you're already using Google everything and want free. Monday.com and Smartsheet have decent financial tracking built in, which is nice since you won't need separate tools. Start by figuring out where your data's coming from and how complex you want to get. Then just pick whatever won't make you want to throw your laptop out the window.
Dude, set up automated validation rules that check your data against the source systems daily. I learned this the hard way after presenting wonky numbers to the CFO once - not fun. Also throw in some user access controls so random people can't mess with your financial data. Daily reconciliation with your ERP and accounting systems is clutch. Set alerts for weird variances too, because catching outliers early beats explaining them later. Oh and keep an audit trail of changes - finance will definitely come asking who touched what numbers from three months ago. Trust me on this one.
Oh man, don't cram everything onto one screen - people will just give up using it. Vanity metrics are another trap, they look cool but won't help anyone make real decisions. Your data needs to actually update regularly and be accurate, obviously. Different people need different views too - what your boss wants to see isn't the same as what you need day-to-day. I learned this the hard way on my last project, honestly. Keep it simple at first. Test it with actual users and fix what doesn't work.
Honestly, real-time budget tracking is a lifesaver. You'll catch overspending way before it becomes a disaster - no more waiting around for those monthly reports that tell you bad news three weeks too late. I learned this the hard way on a project last year. Quick adjustments become possible when you can see exactly where money's going: delayed invoices, resource costs spiraling, whatever. Those tough stakeholder conversations? Way easier when there's actually time to course-correct. Set up threshold alerts though - you don't want to be refreshing dashboards all day like some kind of budget hawk.
Honestly, visual data is a game changer for financial stuff. Your brain just processes charts and graphs way faster than staring at endless spreadsheet rows - nobody has time for that. Spotting budget problems or cash flow issues becomes instant instead of taking forever to hunt through numbers. Bar charts work great for comparisons, line graphs show trends clearly. The trick is matching the right visual to what you're actually trying to figure out. I mean, you wouldn't use a pie chart for everything, right? Start with your biggest financial decisions and pick visuals that'll help you make them faster.
Honestly, having a good financial dashboard is a game-changer for project forecasting. Instead of trying to piece together spreadsheets (which is painful), you get real-time data on spending patterns. Historical info from past projects is super valuable - shows you what actually happened vs what people planned. I always tell people to watch their burn rate closely since it predicts when you'll hit major budget points. Oh, and definitely set alerts at like 75% of each budget category. That way you can fix things before they go sideways. Spotting seasonal trends and cost overruns early saves so much headache later.
Update weekly minimum, but daily's way better if you're dealing with active stuff. Automate the data feeds - trust me, manual entry is where everything goes wrong and it's annoying as hell. Pull directly from your accounting system, not some random spreadsheet that got passed around. Double-check those budget vs actual numbers before you send anything out. Oh, and pick a schedule and actually stick to it so people aren't constantly asking "when's the next update?" Short sentences work. Longer ones with natural flow keep things readable without sounding robotic.
Your stakeholders will love having real-time visibility into budgets and spending without digging through endless spreadsheets. Trust me, it saves so many pointless "where are we at?" meetings. They can spot issues right away instead of waiting weeks for your reports. The transparency thing is huge - everyone sees the same data, so no more finger-pointing or confusion. Set up alerts too, but only for stuff that actually matters or you'll drive them crazy with notifications. Oh, and make sure the dashboard is dead simple to read. Decision-making gets way faster when people aren't squinting at confusing charts.
Ditch the spreadsheets - seriously, nobody wants to decode your formulas. Go visual instead: traffic lights for budget status, progress bars, trend lines that actually make sense. Skip the finance jargon too. Say "over budget" not "variance," and "spending pace" instead of "burn rate." Create little summary boxes with your top 3 points in bullets. Context is huge though - if you're 60% through budget, tell them if that's normal for where you are in the project or if they should panic. Charts beat numbers every time, trust me.
So first pick your top 3-5 KPIs - stuff like budget variance, burn rate, cost per milestone. Then just drag and drop them into widgets however makes sense to you. I'm obsessed with color-coding everything because red numbers immediately catch my eye when budgets are screwed. Connect your accounting software so it updates automatically - saves you from manually entering data all the time. Oh and revenue forecasting is clutch if you're tracking that. Most tools make the setup pretty straightforward once you know what metrics actually matter for your project.
Honestly, connecting your financial dashboard to project management tools is such a lifesaver. No more switching between a million tabs to check if you're over budget. You'll catch cost overruns way earlier and see which tasks are eating up money fast. Way better than updating spreadsheets manually every week (ugh). The cool part is it pulls in timesheets and expense reports automatically, so everything stays up to date. Oh, and start with time tracking integration first – that's usually where projects go sideways budget-wise. Trust me on this one.
Honestly, just ask your users what they think - it's way better than guessing. They'll tell you which metrics actually matter to them (spoiler: probably not the ones you picked). Plus they'll catch confusing layouts or point out when important stuff is buried somewhere annoying. The gap between what we think people want and what they actually need is always bigger than expected. Maybe throw up a feedback button or do some quick check-ins. Oh, and they'll suggest workflow shortcuts you'd never think of. Just don't forget to actually use their feedback once you get it.
Honestly, the biggest game-changers right now are AI alerts that warn you before you blow your budget - way better than scrambling after the damage is done. Mobile dashboards are everywhere too since we're all checking project status during random coffee runs (I do this constantly). Collaboration features are getting sick where people can drop comments right on charts. Scenario modeling is another big one - lets you mess around with "what if we spent X here instead" without breaking anything. Oh, and real-time accounting sync so your numbers actually match reality. I'd start looking at vendors with these features now because your current setup will feel prehistoric soon.
-
Professional and unique presentations.
-
Good research work and creative work done on every template.