


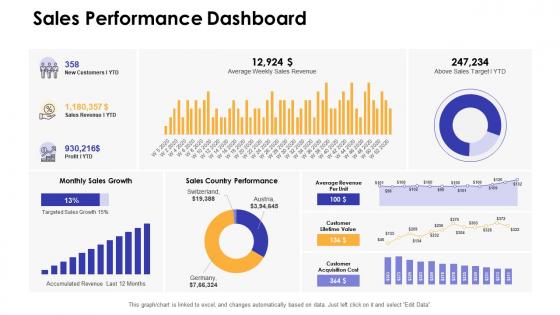
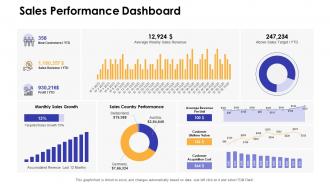
Sales performance dashboard dashboards by function


Try Before you Buy Download Free Sample Product
 Impress Your
 Audience
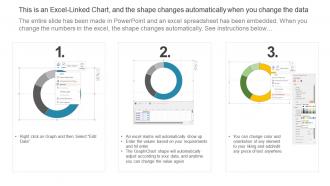
Editable
of Time


Our Sales Performance Dashboard Dashboards By Function are topically designed to provide an attractive backdrop to any subject. Use them to look like a presentation pro.
People who downloaded this PowerPoint presentation also viewed the following :
Sales performance dashboard dashboards by function with all 7 slides:
Use our Sales Performance Dashboard Dashboards By Function to effectively help you save your valuable time. They are readymade to fit into any presentation structure.


FAQs for Sales performance dashboard
Focus on what actually makes you money - conversion rates, deal size, how long sales take, and win/loss ratios. Those are your big four. Obviously track revenue pipeline and quota stuff too. Calls and emails? Sure, but honestly most dashboards I've seen get way too messy with metrics that sound impressive but don't mean much. Customer acquisition cost is solid if you've got that data. Keep it simple first - you can always add more later when you figure out what your team's actually struggling with.
Dude, visualization is a game changer for sales data. You know how staring at endless spreadsheet rows makes your eyes glaze over? Charts and graphs fix that instantly. Your brain just gets it faster when you see bar charts comparing regions or line graphs showing trends over time. Heat maps are clutch too - they'll show you exactly which areas are killing it vs. the ones that need help. I always tell people to start simple though. Pick like 2-3 metrics you actually care about and visualize those first. Don't go crazy with fancy stuff right away.
Dude, real-time data is a game changer for sales dashboards. Instead of looking at yesterday's numbers, you're seeing what's actually happening right now. Hot leads? Jump on them immediately. Problems starting? Fix them before they get worse. I learned this the hard way when we missed a huge opportunity because our data was hours behind. You can adjust your approach mid-day instead of waiting until tomorrow's reports. Though honestly, not everything needs to update live - figure out what metrics really need instant updates versus daily refreshes. Your team will thank you.
Honestly, sales dashboards are game-changers for spotting stuff you'd never catch staring at spreadsheets. Real-time visibility into what's actually working - like your best lead sources, where deals die in the pipeline, which reps need help. Way easier to digest than data dumps (I learned this the hard way). Your team can spot bottlenecks fast and pivot mid-quarter instead of waiting. Focus on maybe 3-5 metrics that actually move the needle. Don't go crazy tracking everything - you'll just confuse yourself and everyone else.
Oh man, don't cram like 20 different metrics on there - nobody can process that mess. Pick 3-5 things that actually matter for revenue. I see so many teams tracking pointless stuff like "total calls made" when they should focus on qualified leads instead. Make sure whatever you track matches how your sales process actually works, not some fantasy version. Keep it simple enough that someone can glance at it and know what action to take. Honestly, if your dashboard doesn't help people make decisions that day, what's the point?
Honestly, just ask people what they actually check first thing Monday morning, then build their dashboard around that. Sales reps want their own numbers - pipeline, quota progress, individual metrics. Managers need the team overview stuff and quick ways to spot problems. For executives? High-level revenue trends work best. They really don't need every deal update cluttering their screen. VPs are different - they want regional comparisons and strategic data they can actually do something with. Each role needs totally different info, so don't try to make one dashboard fit everyone.
Power BI's probably your best bet - cheap, plays nice with most CRMs, and you won't need a PhD to figure it out. Tableau and Salesforce Analytics are solid too if you want something more robust. Your data folks might push for Looker since it's SQL-heavy (they love that stuff). Already using HubSpot or Pipedrive? Their built-in dashboards aren't terrible. Seriously though, I've watched teams burn months building custom solutions when these tools handle like 90% of what you actually need. Just start with Power BI or whatever dashboard your current CRM offers.
Hey! So your sales dashboards can connect to BI tools through APIs, data connectors, or straight database connections. They're all pulling from the same data sources anyway. You can embed widgets into Tableau or Power BI pretty easily - most modern platforms actually work well together now (thank god, because it used to be a nightmare). The main thing is getting your data to flow smoothly between systems so you're not updating everything manually like some kind of cave person. I'd start by figuring out what data goes where, then see what integrations your current tools already have built in.
Dude, you really need that historical data to make sense of your current numbers. Like, maybe you're down 20% this month - but is that normal for this time of year? Hard to tell without looking back. I always pull at least 12-18 months of history. Short bursts show you trends and seasonal stuff you'd totally miss otherwise. It's like trying to figure out if it's actually hot today without knowing what summer usually feels like, you know? Plus you can spot what's been working versus what's been completely bombing. Makes setting realistic goals way easier too.
Set up validation rules that catch errors before they wreck your reports. Define what each KPI actually means first - seriously, I've seen teams argue for hours about what counts as a "conversion." Build in real-time checks for weird outliers or missing data. Do weekly spot-checks where you compare your dashboard against the raw CRM numbers. Having a backup person double-check calculations saves you from looking stupid in meetings (learned that one the hard way). The trick is baking these checks into your workflow upfront instead of scrambling to fix things after your metrics are already toast.
AI predictive analytics is everywhere now - dashboards that actually forecast trends instead of just showing old data. Mobile design matters since we're all constantly checking stuff on our phones anyway. Real-time collaboration is getting big too, where teams can comment and discuss metrics right in the dashboard. Honestly, the best trend I'm seeing? Moving away from those crazy overwhelming charts toward cleaner dashboards that tell a story. They guide decisions instead of just dumping data on you. Start checking what your current setup's missing. Ask your team what insights they actually need day-to-day.
Set up widgets for each rep tracking their deals closed, revenue, conversion rates, and activity stuff like calls and emails. Leaderboards work great too - gets everyone fired up honestly. Pipeline health per person shows you who needs help before things get messy. The cool thing is catching problems early when someone's numbers start sliding. Weekly dashboard check-ins with each team member are clutch for this. I actually think the activity tracking matters more than people realize - it's usually the first sign when someone's struggling. Way easier to fix issues when you spot them fast instead of waiting till month-end.
Dude, mobile dashboards are clutch when you're always driving between meetings. You can check your pipeline from literally anywhere - coffee shop, client parking lot, whatever. Real-time notifications hit your phone so you won't miss when a hot lead finally responds. Quick tip though: test it on your actual phone first because some are still garbage on mobile (learned that the hard way). Being able to pull up numbers during random conversations with your manager is pretty sweet too. Honestly beats having to wait until you're back at your desk to see how you're tracking.
Honestly, I'd start small with just one forecasting widget - maybe projected revenue or deal probabilities. Tableau and Power BI both have decent ML features built in, so you don't need to reinvent the wheel here. Clean data is crucial though (learned that the hard way). Once you've got that predictive element working, test it against actual results for a few weeks. If it's tracking well, then add more stuff like churn risk or territory forecasts. Pipeline predictions are super useful too. The trick is not overwhelming your dashboard right away - I've seen people go overboard and end up with something nobody actually uses.
Look, KPIs are like your dashboard's report card - they show if people actually use the thing or if it's just sitting there looking nice. Track stuff like adoption rates and whether your team hits targets faster now. Time-to-insight is huge too. Honestly, I've watched so many beautiful dashboards collect digital dust because nobody checks if they're working! Focus on whether it cuts down reporting time and improves data accuracy. Maybe your team makes better decisions faster? Pick 3-4 metrics that actually matter to you guys and review monthly. That'll tell you if the investment was worth it.
-
Designs have enough space to add content.
-
Easily Editable.