


Sales And Operations Planning Dashboard To Drive Better Performance


Try Before you Buy Download Free Sample Product
 Impress Your
 Audience
Editable
of Time


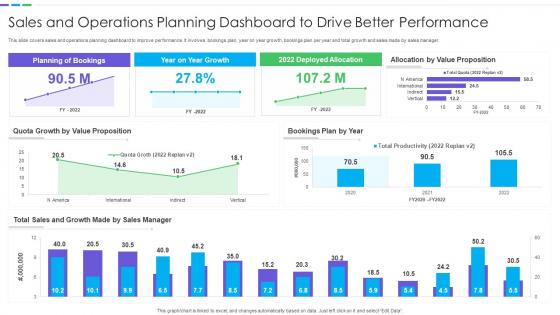
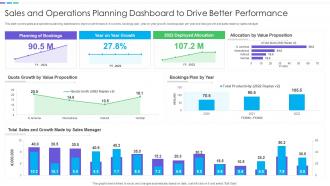
This slide covers sales and operations planning dashboard to improve performance. It involves bookings plan, year on year growth, bookings plan per year and total growth and sales made by sales manager.
People who downloaded this PowerPoint presentation also viewed the following :
Sales And Operations Planning Dashboard To Drive Better Performance with all 7 slides:
Use our Sales And Operations Planning Dashboard To Drive Better Performance to effectively help you save your valuable time. They are readymade to fit into any presentation structure.


FAQs for Sales And Operations Planning Dashboard To
Start with pipeline velocity and conversion rates by stage - those two will tell you everything. Average deal size and sales cycle length are must-haves too. Lead response time matters more than people think, and quota attainment is obvious but still track it. Forecast accuracy is huge for keeping leadership happy, trust me on that one. Oh, and don't skip activity metrics like calls and meetings - they're your early warning system for revenue issues. These basics will cover you, then just add whatever else your team's actually struggling with.
Dude, real-time dashboards are a game changer. You'll catch problems while they're still fixable instead of weeks later when deals have already tanked. Picture this - you can actually see which reps are killing it and which deals are stuck in limbo. Way better than those dusty spreadsheets everyone pretends to update. The trick is setting up alerts for stuff that actually moves the needle (not every tiny metric under the sun). I swear it's like having superpowers for your pipeline. No more guessing games or "gut feeling" decisions when you've got live data right there.
So the biggest win is you'll finally see your whole sales pipeline without switching between like 5 different tabs. Your CRM data flows straight into the dashboard, which means no more guessing games with forecasts - they're actually based on real customer interactions now. You can spot where deals are getting stuck and see which reps are crushing it versus struggling. Honestly, once you connect your top 3 metrics first (I'd go with conversion rates, deal velocity, and rep performance), you'll wonder how you survived on spreadsheets before. The patterns become super obvious when everything's in one place.
Honestly, these dashboards are game-changers for forecasting. Real-time pipeline visibility beats guessing with old spreadsheets any day. You'll catch patterns in deal velocity and conversion rates that you'd never spot manually. Last quarter they literally saved me from multiple pipeline disasters - the automated alerts flag stalling deals before they wreck your numbers. Seasonal trends become super obvious too. My advice? Start tracking deal stage progression rates first. That's where most people have massive blind spots, and it's probably the easiest win you'll get.
So automation is what stops your sales dashboard from turning into a nightmare of manual updates. Set up data pulls from your CRM and marketing tools so everything refreshes automatically - nobody should be copy-pasting numbers at 8am every day. It'll clean your data and calculate KPIs without you thinking about it. Plus you can get alerts when metrics hit certain levels, which is actually pretty handy. The trick is figuring out what needs daily updates vs weekly ones, then building those workflows. Honestly saves so much time it's ridiculous.
Honestly, the best dashboards let you compare individual vs team numbers at a glance. You'll spot patterns super fast - like Sarah crushes her closes but never prospects, or Mike has crazy activity but can't convert anything. Way easier than those monthly spreadsheet deep-dives we used to do (ugh). Break everything down by rep, territory, and timeframe so you can tell if someone needs coaching on specific stuff or they're just in a slump. Then you can pair them with mentors or shuffle territories around. Makes the whole process less guesswork, more actual strategy.
Integration stuff first - grab something that connects easily to your CRM and marketing tools. Pre-built connectors save you from API hell, which nobody wants to deal with. Real-time updates are a must, and make sure it has different visualization options since your boss probably wants charts while you want raw numbers. Oh, and check mobile access if you're ever out of office. User permissions matter too. Honestly though, skip their demo data and test it with your actual messy data during the free trial - that's where you'll see if it actually works.
You'll want to set up separate views for each group - they're all looking for completely different stuff. Sales reps care about pipeline updates, deal stages, quota numbers. Managers need team metrics and conversion data. Executives just want the big picture revenue trends, not every tiny detail (honestly, they'd probably ignore granular stuff anyway). Most tools have role permissions or tabs you can customize. But here's the thing - talk to each group first about what decisions they're actually trying to make. Then work backwards from there to figure out what data matters.
Honestly, the worst thing you can do is cram like 15 different metrics on one dashboard. Nobody knows where to look and nothing gets done. Test it with a few sales reps first - they're the ones staring at it all day, not you. Also make sure your data isn't complete garbage before building the whole thing out (learned that one the hard way). Skip the vanity stuff like "total pipeline: $2M!" without any context about what's realistic. I'd stick to maybe 5-6 metrics that actually help people make decisions. Simple beats fancy every time.
Historical data is gold for spotting real trends vs random noise. Compare year-over-year numbers and watch for seasonal patterns - seriously, I've watched teams panic over totally predictable holiday dips they should've seen coming. Check conversion rates over time to set targets that actually make sense. Your past performance shows you what good looks like and helps you figure out what your best people are doing differently. Oh, and don't just stare at dashboards all day. Set up alerts when things go weird so you can jump on problems fast instead of finding out weeks later.
Honestly, having your sales dashboard on mobile is a game changer. You can check lead statuses between meetings or update deals while waiting for your coffee (I do this way too much). When something's stuck in your pipeline, you'll spot it right away instead of finding out three days later at your desk. Clients definitely notice when you respond faster too. The real-time thing means you can actually fix problems as they happen. Just grab the app and turn on notifications for the stuff that matters most. Trust me, once you start using it you won't go back.
Training is honestly huge - maybe the most important thing. I've watched teams build incredible dashboards that just sit there collecting dust because nobody knows what to do with the data. Your sales people need to actually understand what those numbers mean for their day-to-day work, not just how to navigate around. It's like giving someone keys to a sports car when they've never driven stick shift. Focus on real scenarios they'll face, skip the boring generic walkthroughs. Otherwise you're just wasting money on something that looks pretty but doesn't help anyone hit their numbers.
Honestly, just keep it basic for sales dashboards. Bar charts work best when you're comparing team performance or looking at different time periods. Line charts are perfect for tracking revenue trends over months. Don't go crazy with pie charts though - maybe only for territory breakdowns or similar stuff. Tables are actually clutch for when your team needs to dig into the actual numbers. I've seen too many people get obsessed with those flashy 3D charts that look impressive but nobody can read them properly. Put your biggest KPIs right at the top, then add the detail stuff underneath.
Dude, interactive stuff is a game changer for dashboards. Instead of boring static charts, give people drill-downs and filters they can actually play with. Hover tooltips are clutch too. Your sales team will love clicking around to see what's behind the numbers - way better than staring at spreadsheets all day. Start simple though, like basic time period or region filters. Those get used constantly. The whole point is making people feel like they're uncovering insights themselves, not just reading someone else's report. Trust me, once they start exploring the data, they'll be hooked.
So the biggest thing? You can actually click around and dig into stuff instead of just looking at boring charts. Like, slice by territory or time period - whatever you need. Updates happen automatically too, which beats those awful PDF reports we used to deal with. Basic reporting just tells you what already happened. But dashboards? They help you figure out the why behind everything. Honestly, start by nailing down which numbers your team actually looks at every day - no point tracking metrics nobody cares about.
-
Excellent design and quick turnaround.
-
Great experience, I would definitely use your services further.