


Sales And Operations Planning Powerpoint Presentation Slides
Here is our sales and operations planning PowerPoint presentation slides. Operational plan Is a process where sales department merges with operations to work on a single production plan. By using sales and marketing plan templates, you can track sales performance and your competitor’s performance as well. This S&OP presentation has variety of slides like business overview, financial highlights, product offerings, sales performance, dashboards, quarterly sales review, project updates, process map, customers and vendors, sales KPI’s, competitive analysis, future perspective, business process roadmap, opportunity timeline, major obstacles etc. more pressingly or importantly our, product and operational plan PPT can be used for the essential topics like production plan, supply chain management, financial and operational planning, sales decision making process, sales and supply, demand chain management, demand forecasting, supply and demand, production planning etc. Utilizing our supply chain management PowerPoint presentation you can prepare your employees to perform in better way for production management process. What are you waiting for? Just click on download and get our sales and operational planning PowerPoint presentation designs. It will help you fulfilling business. Explain aspects critical to the cause with our Sales And Operations Planning Powerpoint Presentation Slides. It helps identify important inputs.
Here is our sales and operations planning PowerPoint presentation slides. Operational plan Is a process where sales departm..


-

- Google Slides is a new FREE Presentation software from Google.
- All our content is 100% compatible with Google Slides.
- Just download our designs, and upload them to Google Slides and they will work automatically.
- Amaze your audience with SlideTeam and Google Slides.
-

Want Changes to This PPT Slide? Check out our Presentation Design Services
-

- WideScreen Aspect ratio is becoming a very popular format. When you download this product, the downloaded ZIP will contain this product in both standard and widescreen format.
-

- Some older products that we have may only be in standard format, but they can easily be converted to widescreen.
- To do this, please open the SlideTeam product in Powerpoint, and go to
- Design ( On the top bar) -> Page Setup -> and select "On-screen Show (16:9)” in the drop down for "Slides Sized for".
- The slide or theme will change to widescreen, and all graphics will adjust automatically. You can similarly convert our content to any other desired screen aspect ratio.
Compatible With Google Slides

Get This In WideScreen
You must be logged in to download this presentation.


Do you want to remove this product from your favourites?
PowerPoint presentation slides
This presentation is useful for the management team, business owner. Designs are 100% editable in PowerPoint. This is the presentation has 65 slides. It is compatible with both the standard and widescreen. PowerPoint slides are 100% risk-free. PPT templates are compatible with google slides. Premium support for our customers. The stages in this process are Sales And Operations Planning, Sales Management, Sales Operations.

People who downloaded this PowerPoint presentation also viewed the following :
Content of this Powerpoint Presentation
‘Take the next exit in 200 meters to avoid road blockage.’
A simple alert on Google maps helps you reach places on time! With evolving technology, the right data is collected and used to help you reach your destination.
Wouldn’t it be convenient if, as a business, you knew when to push your teams or which resources to invest in while steering clear of all the obstacles? That’s where Sales and Operations Planning (S&OP) steps in. It is a cross-functional planning process to align sales, customer service, manufacturing, marketing, finance, and supply chain. It helps business management make informed decisions, in light of factors that could impact demand, including new product introductions and promotions.
The S&OP process is the broader framework in which demand and supply planning play an integral part. Many companies that implement demand planning and supply planning believe they have an S&OP process in place. However, these businesses fail to fully use the collaborative benefits of manufacturing and inventory planning with demand and supply planning for organization-wide growth, as coordination between the departments is difficult and costly.
Sales & Operations Planning enables a holistic planning process that effectively and efficiently aligns all processes as well as supply and demand - in a practical and reliable manner. There are clear responsibilities and procedures in the monthly process that make this possible.
The Process of Sales & Operations Planning
At the beginning, all parties (customer service, manufacturing, marketing, finance, and supply chain teams) involved come together to collect and evaluate relevant information. During the demand review, the sales performance is analyzed and a forecast arrived at to ensure that an ideal demand plan for purchasing, production and logistics can be derived. Demand Planner, Sales, Product Management and Marketing are involved. Supply Planner, Purchasing, Production and Logistics check whether the demand forecast by Sales and Sales Planning can be met with the current resources and capacities. The reconciliation and alignment between Supply Plan and Demand Plan takes place.
In the pre-S&OP meeting, a target/actual comparison is carried out by department heads , thus creating a basis for decision-making by the management. At the end, the participants from the Pre-S&OP meeting decide with the management, based on the recommendations for action, how the operational implementation of the measures will take place or where there is still a need for change.
To plan, execute, and record this process with ease, get your hands on this Sales And Operations Planning PPT Presentation. The 100% editable and customizable nature of these PowerPoint Templates provides you with the structure and the desired flexibility to edit your presentations.
Let’s explore the Templates:
Template 1: Financial Highlights PPT Template
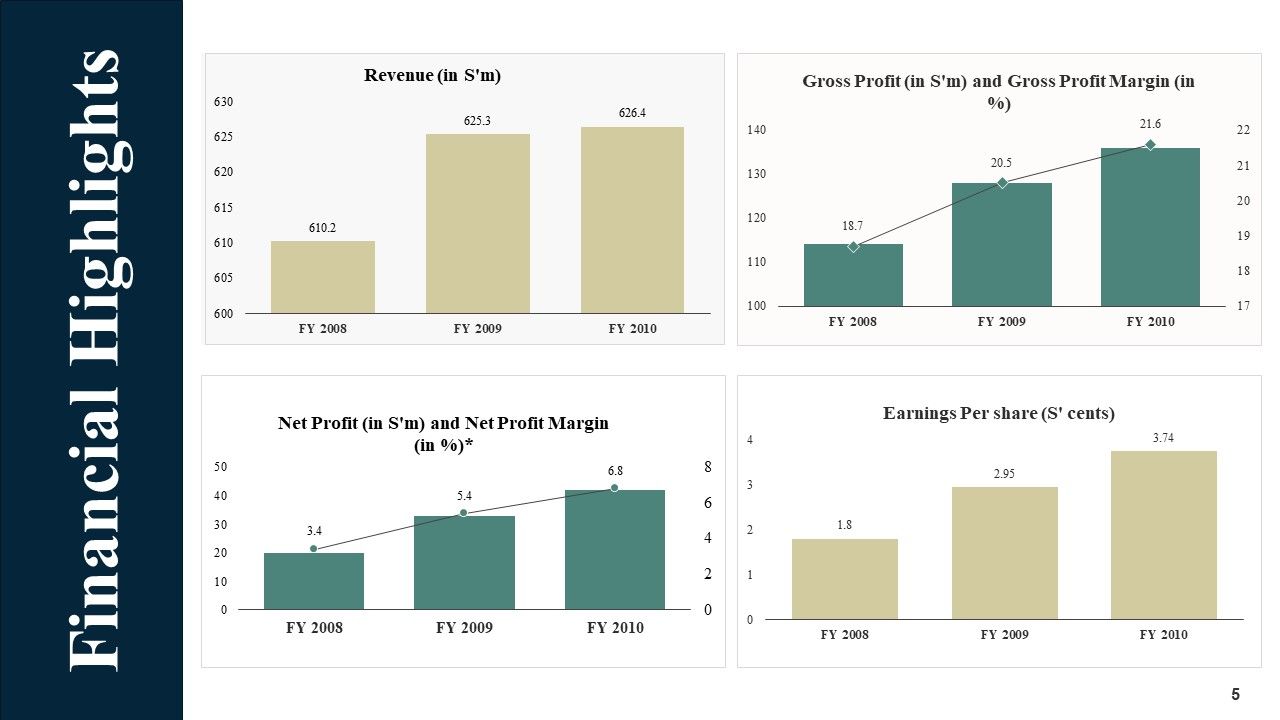
Financial highlights summarize the monetary results of an organization. Use this PPT Template to track a company’s financial history. The bar graphs provided in the design layout enable you to track revenue, gross profit, net profit, and earring per share. The visual aid helps in studying the trends at a glance. Get access now!
Template 2: Quarter Track Record PPT Template
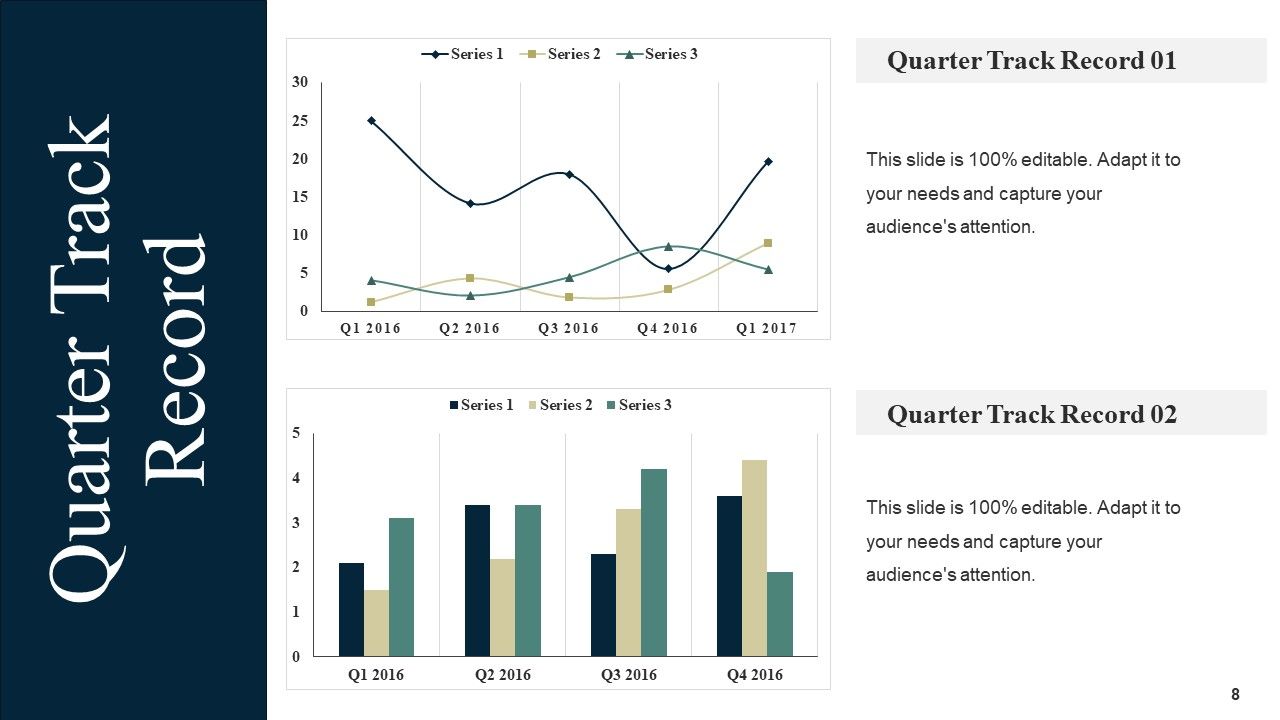
Companies typically prepare financial reports four times a year, on a quarterly basis. These quarterly reports can be used to make financial projections, and pitch funding to investors. With this PPT Template, you can analyze the trends in two formats. The line graphs help you to report growth or decline of factors over the past year. The histogram helps you compare the factors in each quarter. Download Now!
Template 3: Sales Performance PPT Template
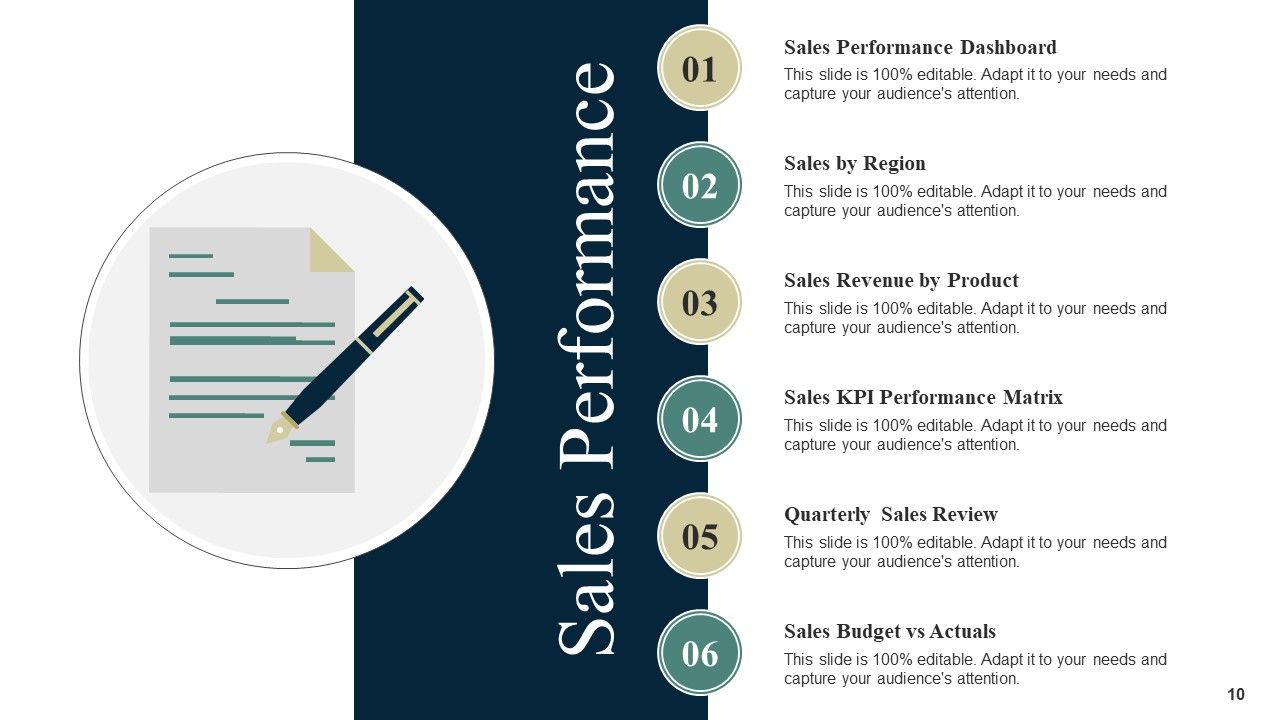
Sales data help you make better decisions about your product, pricing, promotions, inventory, customer needs and other aspects of your business. It is crucial to review your sales data regularly and look for opportunities to improve your business. With this PPT Template, you can segregate your sales performance based on product and region. Make sales notes of KPI Performance matrix, sales dashboard, and sales review. Compare the sales budget to the actual sales to plan future budgeting. Download Now!
Template 4: Sales Performance Dashboard PPT Template
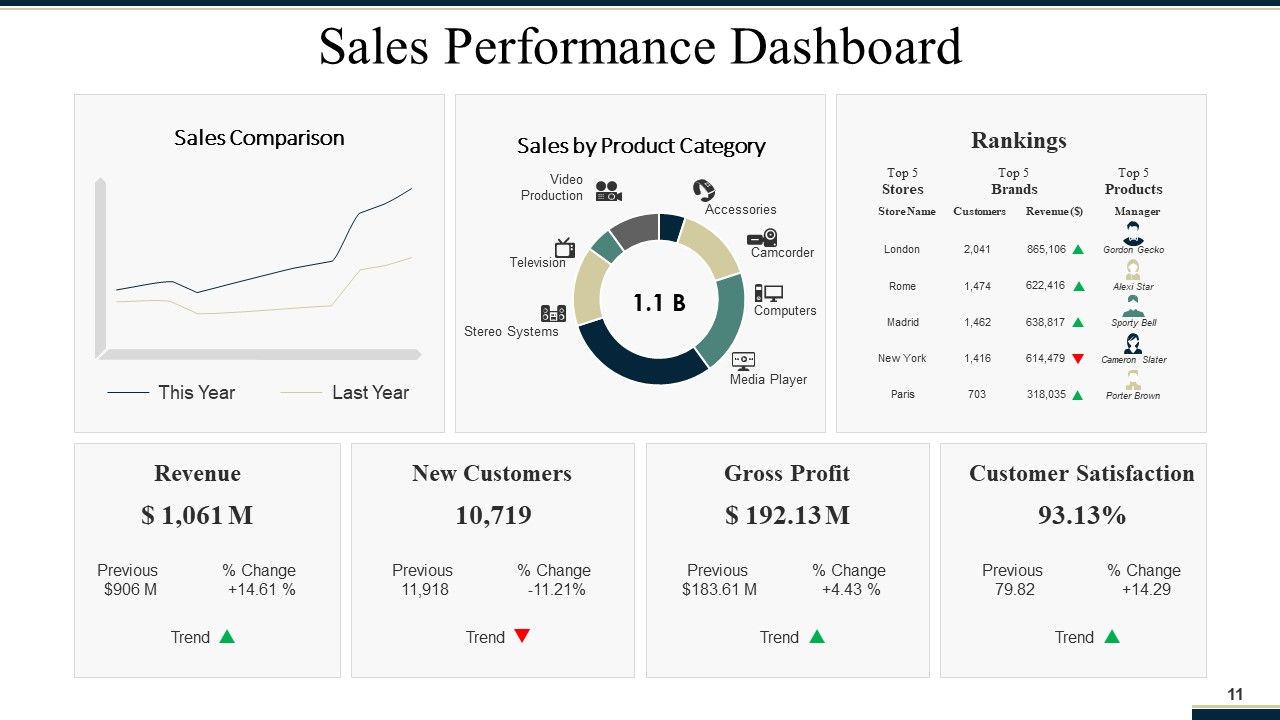
Sales teams operate in a fast-paced, target-oriented environment. This dashboard template will provide an at-a-glance view of your sales team's performance. Data-driven sales managers and reps can monitor their individual and team performance on a daily basis and adjust or improve their strategies in real-time. The PPT Layout has a line graph, pie chart, ranking table to collect and present sales data. The column below presents the highlights in the diagram and displays the revenue, new customers, gross profit, and customer satisfaction percentage. The red and green arrows depict the trend of the factors above. Download Now!
Template 5: Sales Revenue PPT Template
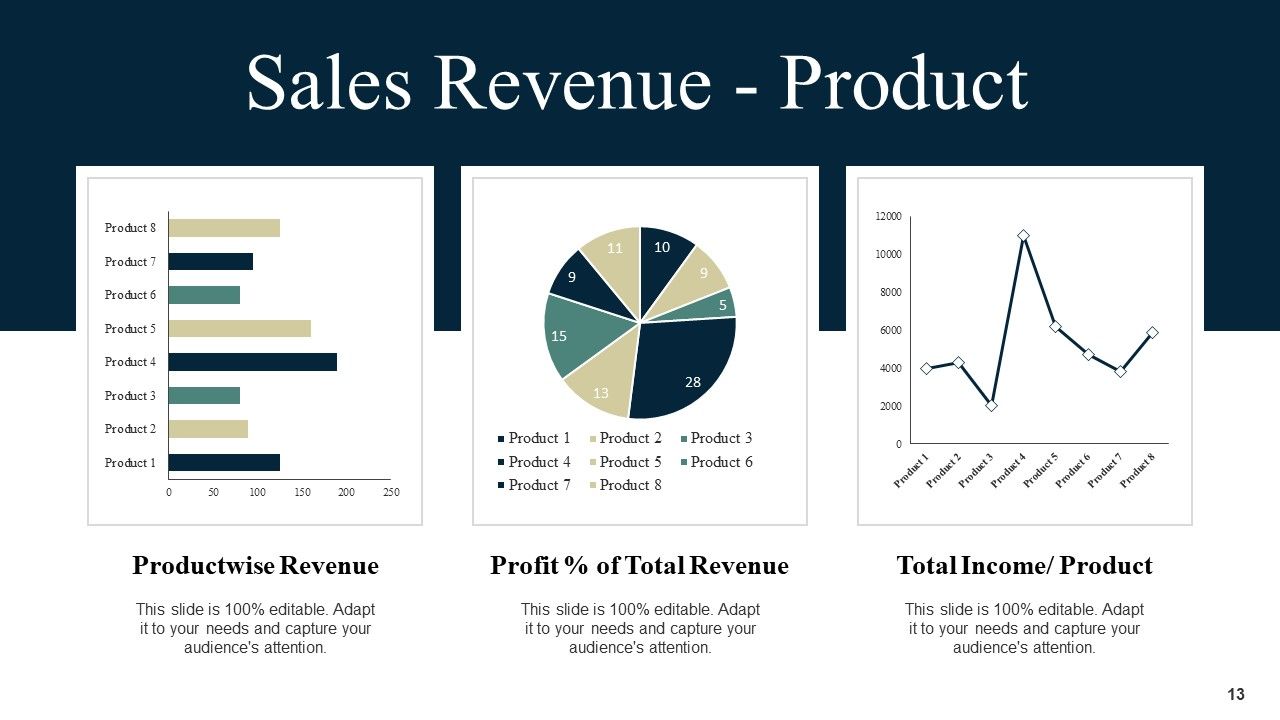
This PPT Template allows you to present sales revenue data with visual aid like a bar graph, pie chart, and a line graph. Visual diagrams are only as good as their analysis. The text placeholders under each diagram in the Template provide you space to analyze the diagram, take note of the interpretations , and brainstorm action plans. To optimize the use of infographics, download now!
Template 6: Sales Rep Performance Scorecard PPT Template
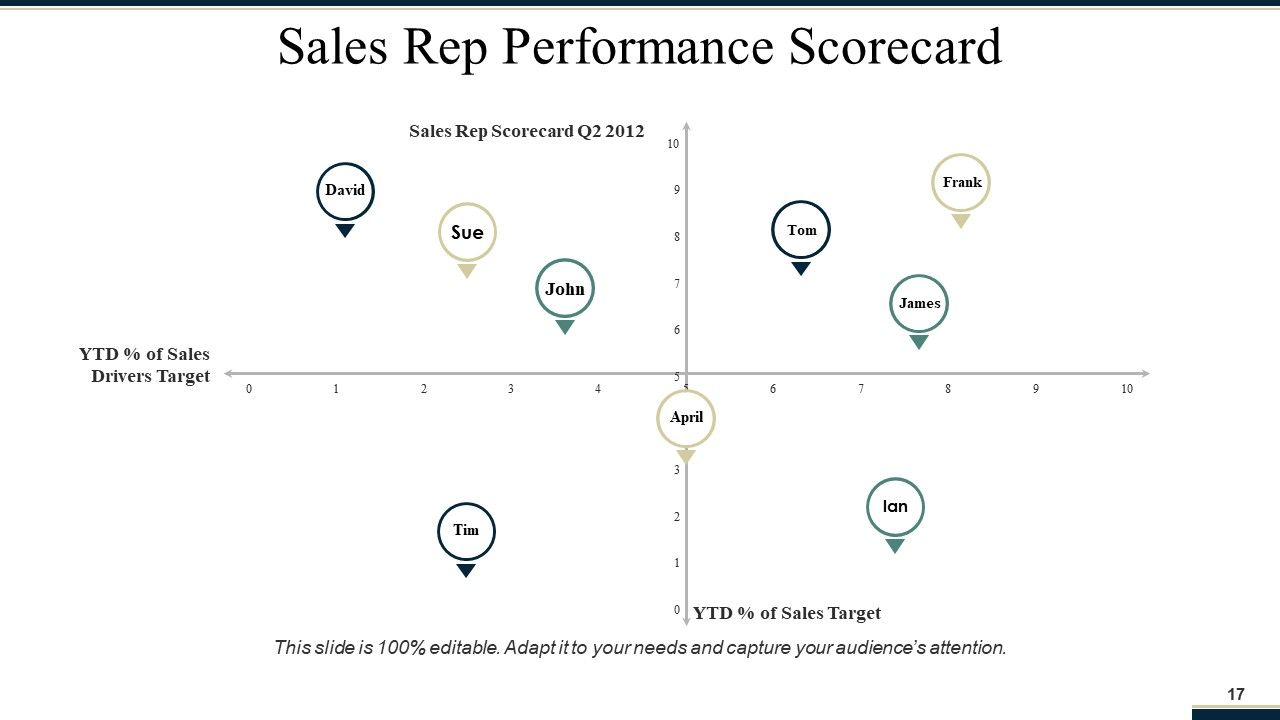
When managing a sales team, keeping on top of performance and outputs is critical. Often, sales managers use dashboards, CRMs and analytics to measure sales success and share the results with their team for motivation. This Scorecard Template will make your work easier. You can track and plot the performance of your team members on the graph with the X-axis representing the YTD % of Sales Driver Targets and the Y-axis representing YTD % of Sales Target. You can track the improvement in every member's performance with movement of each individual across the graph. Download Now!
Template 7: Sales Process Map PPT Template
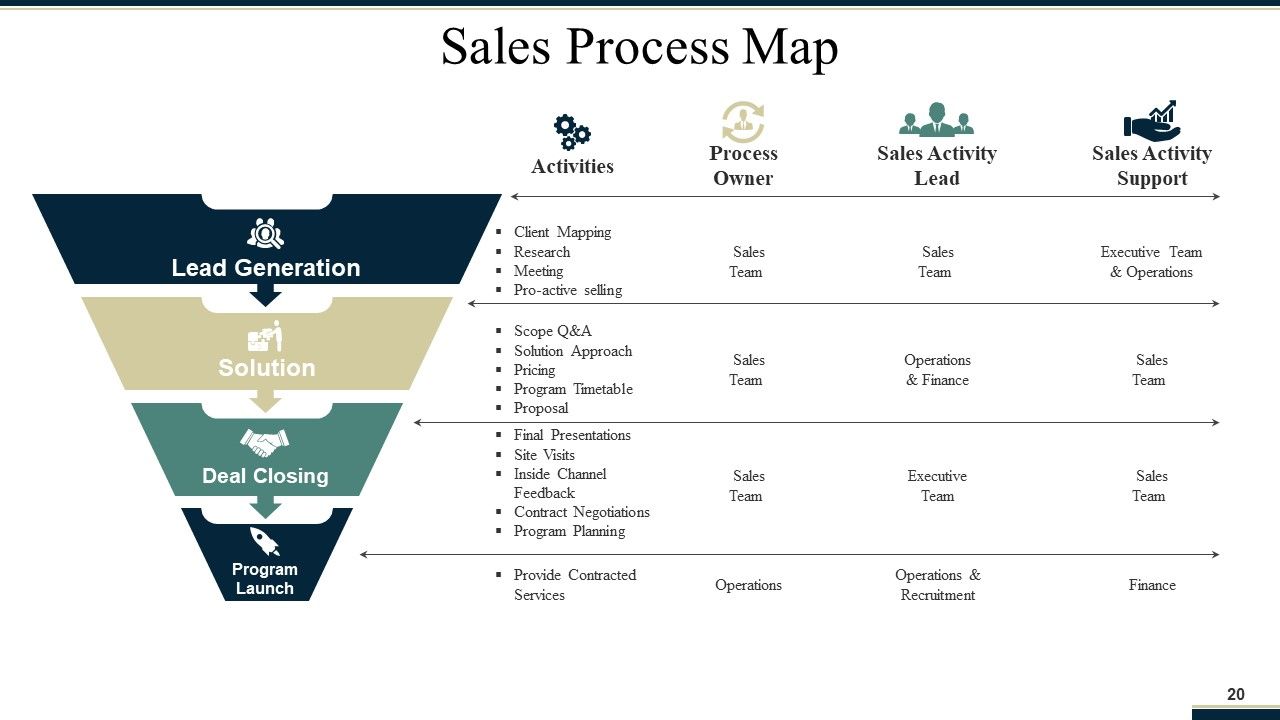
A sales funnel helps marketers understand a customer’s purchasing journey, while also identifying what stage of this journey the customer is at. Well-built sales funnels without gaps allow companies to shepherd potential customers through the buying process towards purchase completion. Ensure that your clients make it to the completion stage with this PPT Template. Alongside the funnel, plan your activities using the table provided. Assign tasks to the process owners, the team that the sales activity is being led by, and the supporting team. Download Now!
Template 8: Sales Activities Dashboard PPT Template
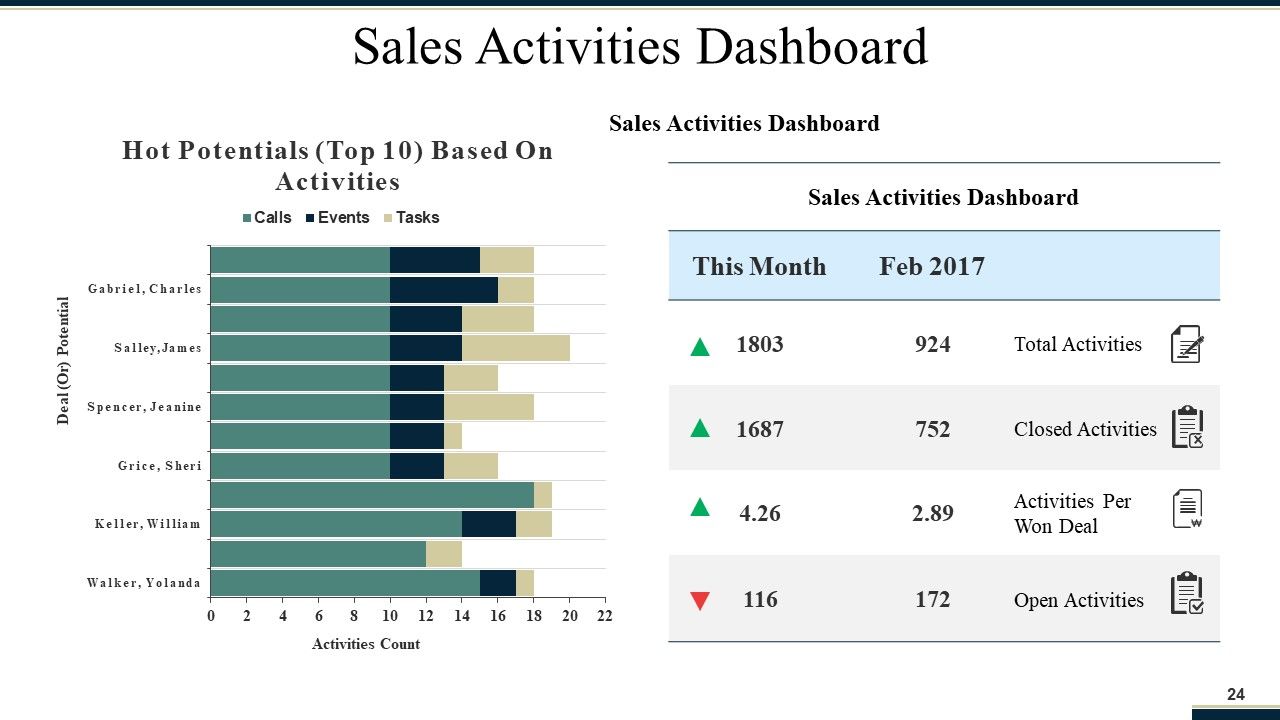
If you work in sales, you may need to perform some tasks to help increase how many customers buy your product. The slide is a sales activities dashboard that tracks the top ten salespeople (or potentials) by their sales activities in a month. It breaks down their activity into three categories: Calls, events, and tasks. The dashboard also shows the total number of activities for each salesperson, the number of closed activities, the average number of activities per won deal, and the number of open activities.
Sales managers can use this information to identify which salespeople are most active and to track their progress towards their sales goals.
Template 9: Sales KPI Tracker PPT Template
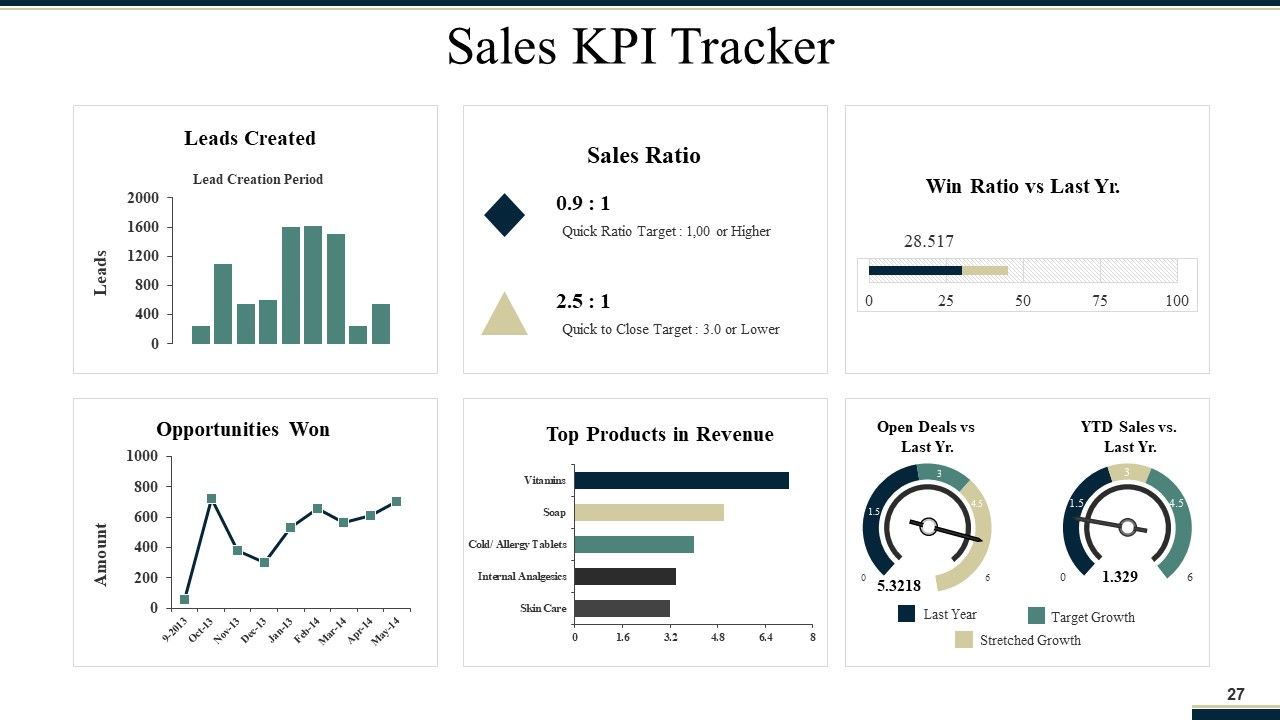
The faster you can turn your data into insights, the better. But putting information together to tell the right story through eye-catching visualizations can be time-consuming so we’ve done it for you with this PPT Template. The KPI Tracker displays a collection of charts and graphs that track sales metrics. It includes lead creation progress over a time period, sales ratios, opportunities won, top products in revenue, open deals versus last year, and year-to-date sales versus last year. Download Now!
Template 10: Sales Performance of Competitors PPT Template
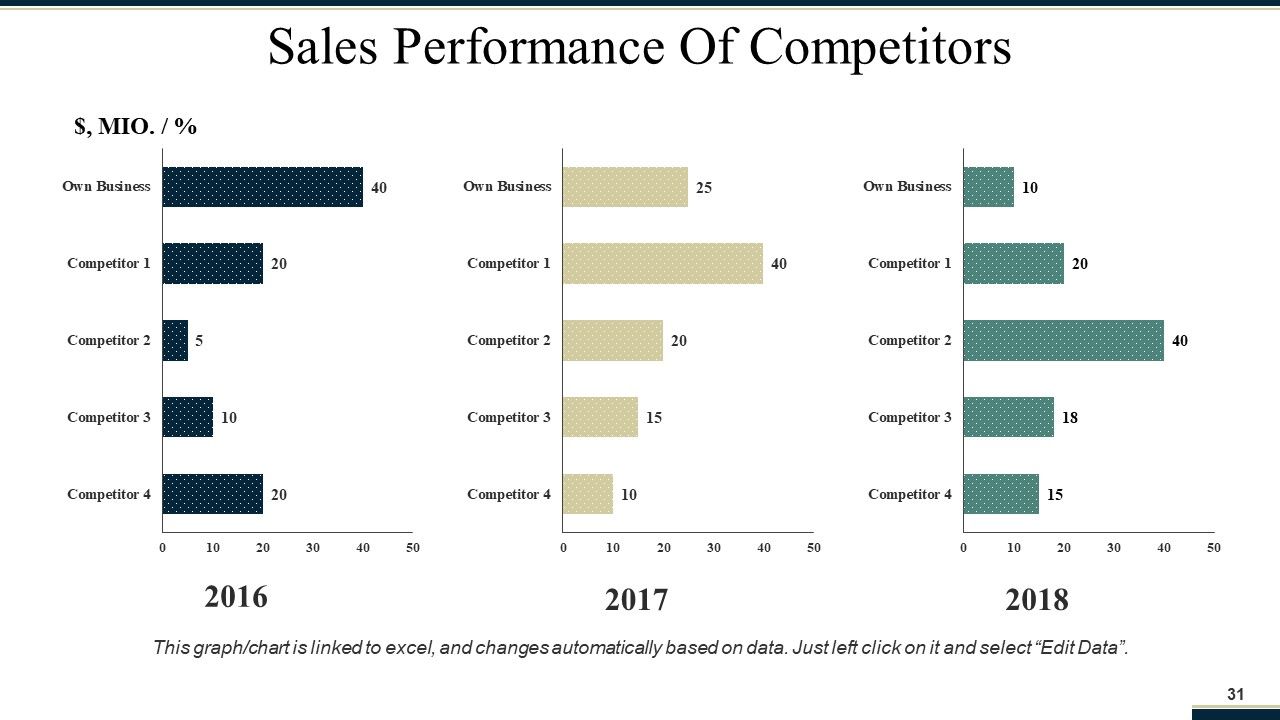
In this competitive era, understanding factors that lead to sales force performance is critical to an organization’s success. It is equally vital to understand your competitors' position in the marketplace. Use this PPT Template to compare the sales performance of up to four competitors to your company’s own sales performance over the past three years. The X-axis of the graph is labeled “Year” and shows the years. The Y-axis of the graph is labeled “Sales (SMIO./%)” and shows sales in millions with a percentage increase or decrease. This graph/chart is linked to excel, and changes automatically based on data, you can left click on the graph to edit data. Download Now.
Over the years, sales and operations
planning has evolved from a simple demand-supply alignment process into an advanced business management process that streamlines business functions and enables companies to correctly predict market trends and make the best decisions about their product development.
With this Sales and Operations Planning Presentation, you can keep note of every aspect of your company on the same page allowing for a smoother functioning, more cohesive organization.
Sales And Operations Planning Powerpoint Presentation Slides with all 65 slides:
Help folks handle every difficulty with our Sales And Operations Planning Powerpoint Presentation Slides. They allow you to give constructive advice.
-
I truly enjoyed these slides and apprecite your work. Thanks
-
Very well designed and informative templates.
-
Illustrative design with editable content. Exceptional value for money. Highly pleased with the product.
