Every business performs day-to-day activities to achieve its core objectives. These activities that contribute towards achieving the goals of the business are called the operations of a business.
Depending on the complexity of a business, there can be operational activities being carried out simultaneously. In such scenarios, it becomes imperative to conduct an analysis of each of these activities to determine its efficiency and effectiveness for the business. It is at this point operational performance steps in.
Meanwhile, if you need templates for the operations dashboard, click here to check our top-selling templates.
Operations performance is the measurement of a business's operations against certain Key Performance Indicators (KPIs) to determine the usefulness of an operational activity. KPIs of one business can differ acrosss businesses. Here are some of the most commonly used KPIs to measure the operation performance across businesses:
- Overall Equipment Effectiveness (OEE): The efficiency of the equipment a business uses, including quality, performance, etc.
- Cycle Time: The time it takes for a process from start to reach the end.
- Lead Time: The time it takes to deliver an order to the customer once the order is received.
- Employee Turnover: The net number of employees leaving a business every year.
- Cost per Unit: The cost a company bears to produce a single unit of a product.
- Consumer Satisfaction: How satisfied your consumers are with your product or service.
A deeper analysis of every KPI will help you understand the respective operations that need to be improved, changed, or discarded.
Now it is time to take a look at PPT Templates from SlideTeam that can assist you in your operations performance analysis.
These PPT Slides are easy to use and provide you with the necessary content and structure to create reports in minutes. Each of these templates is 100% customizable and editable to help you tailor-made your presentation to specific audience profiles.
Let’s begin.
You can also use our executive performance templates to report the performances of your leadership by clicking here.
Template 1: Banking Operations Performance Tracking Dashboard Strategic Improvement In Banking Operations
The first template on the list is a very suitable choice for bankers who wish to analyze the performance of their banking operations. It has been designed keeping in mind the six KPIs primarily catering to the banking sector, such as accounts opened and closed, referrals by product, and others. Depending on the KPI, we have inserted diagrammatic representations to simplify the analysis. Get this template right away to improve the efficiency of your banking operations today!
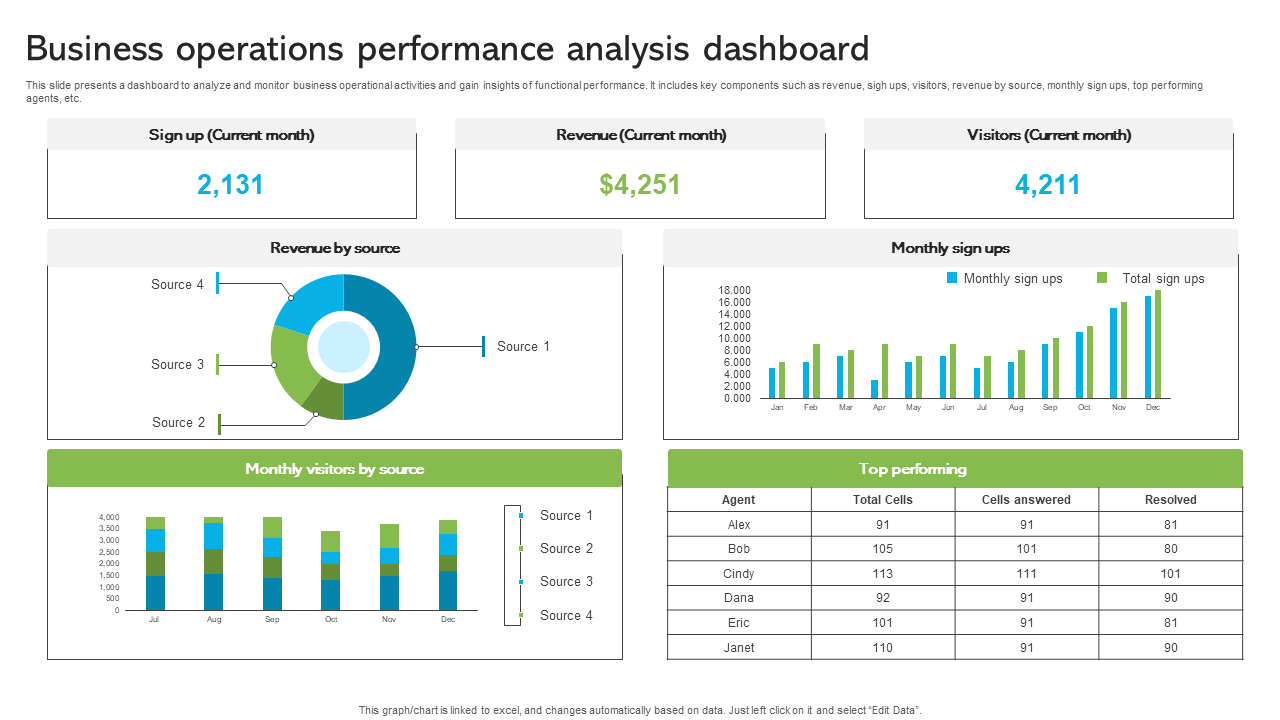
Template 2: Business Operations Performance Analysis Dashboard
A business can have multiple operations going on at the same time. Hence, creating and referring to reports for each operation is not always feasible. It is especially when you are under such scenarios that this template can help you save the day. We have clubbed functional, yet most commonly conducted operations of a business in one report to help you keep track of your revenue, sign-ups, visitors, etc, for each month. Get this template to help you make your monthly reporting of business operations super easy.
Template 3: Dashboard To Evaluate Hospital Operations Performance Functional Areas Of Medical
The hospital management runs very differently than other regular businesses. The healthcare industry determines its performance based on the number of patients it has cared for and their satisfaction levels. Keeping these parameters in mind, this template has been designed, especially for healthcare professionals, to aid them in measuring the operation performance of their hospital. Purchase now to enhance the services of your facility.
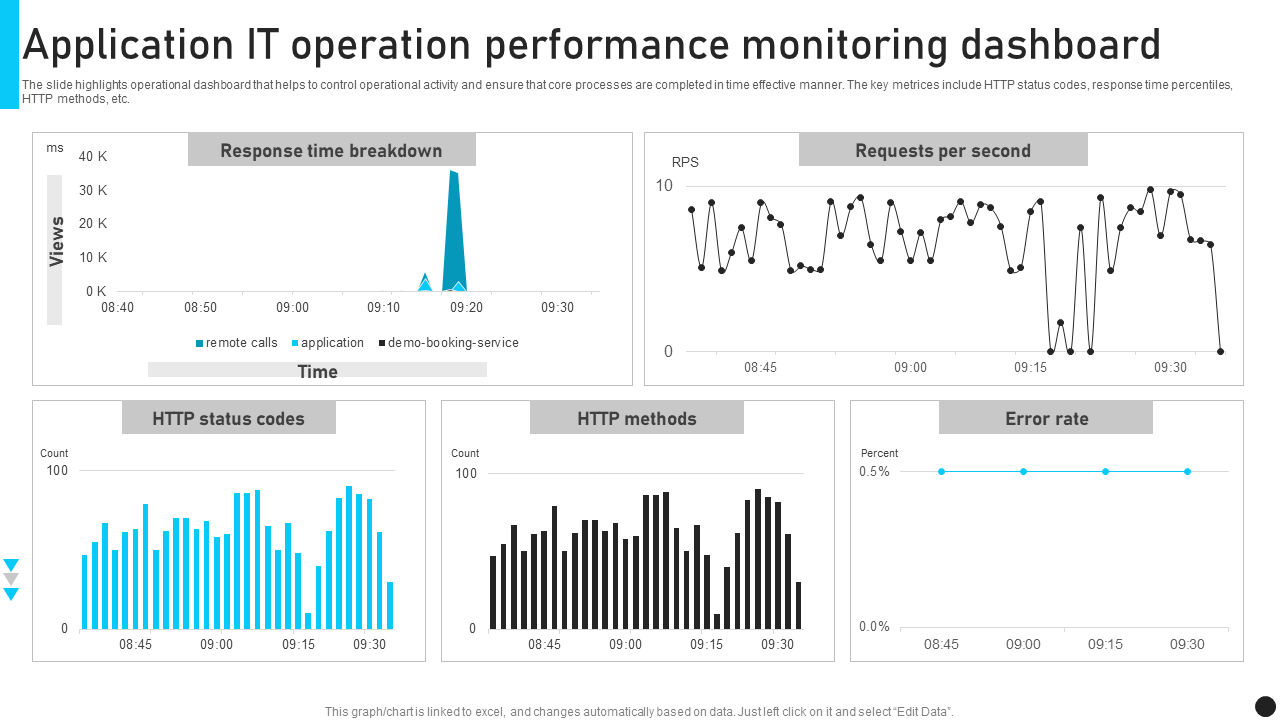
Template 4: Application IT Operation Performance Monitoring Dashboard
When it comes to the IT sector, every additional second a product takes to respond can make a huge difference. Without overlooking speed, we bring to you our next template in the deck. It is a simple, minimalistic, and compact template that makes your performance analysis report crisp and easy to understand. Decked with metrics such as response time breakdown, error rate, requests per second, etc, this template is all you need for your IT business. Get it right away.
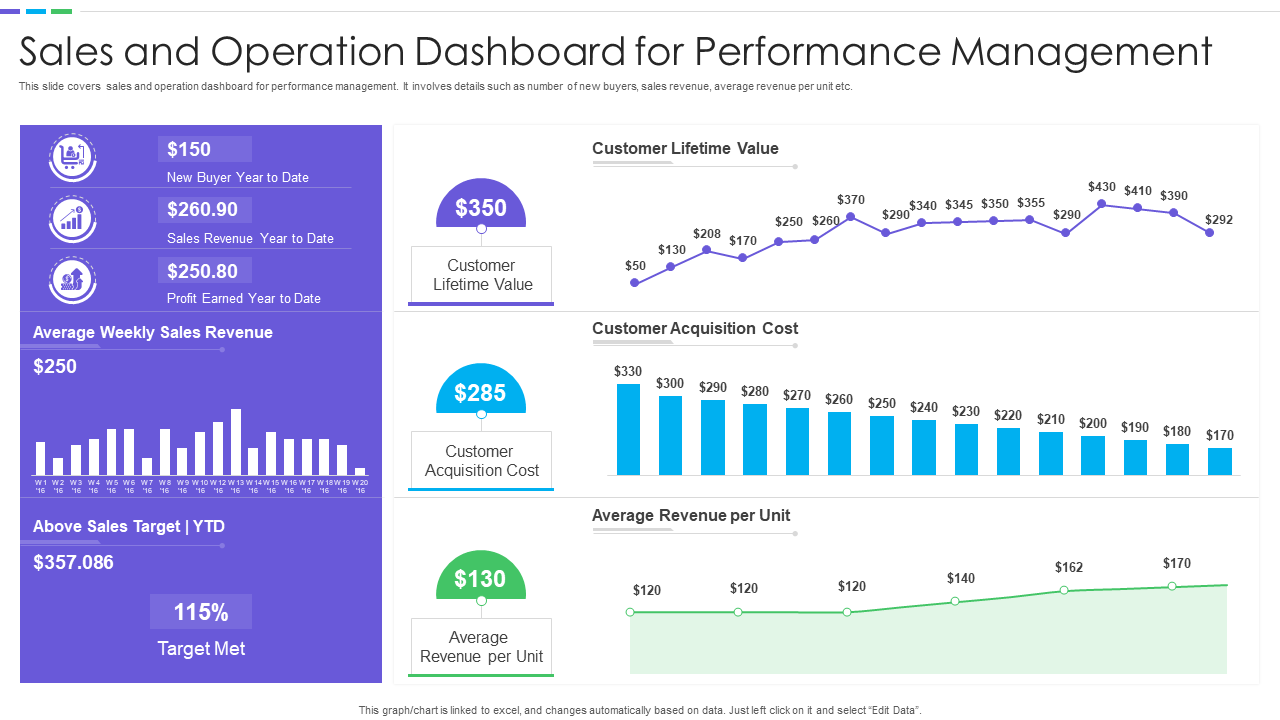
Template 5: Sales And Operation Dashboard For Performance Management
Irrespective of how marvelous our product is, you must be able to sell to keep your business afloat. This is where you need to analyze the sales performance of your business. Our next template on the list is a report card of your entire sales team on one page that helps you check metrics such as customer lifetime value, customer acquisition cost, average revenue per unit, etc. Determine the capability of your sales force by making an easy analysis with our template. Get one for your business now.
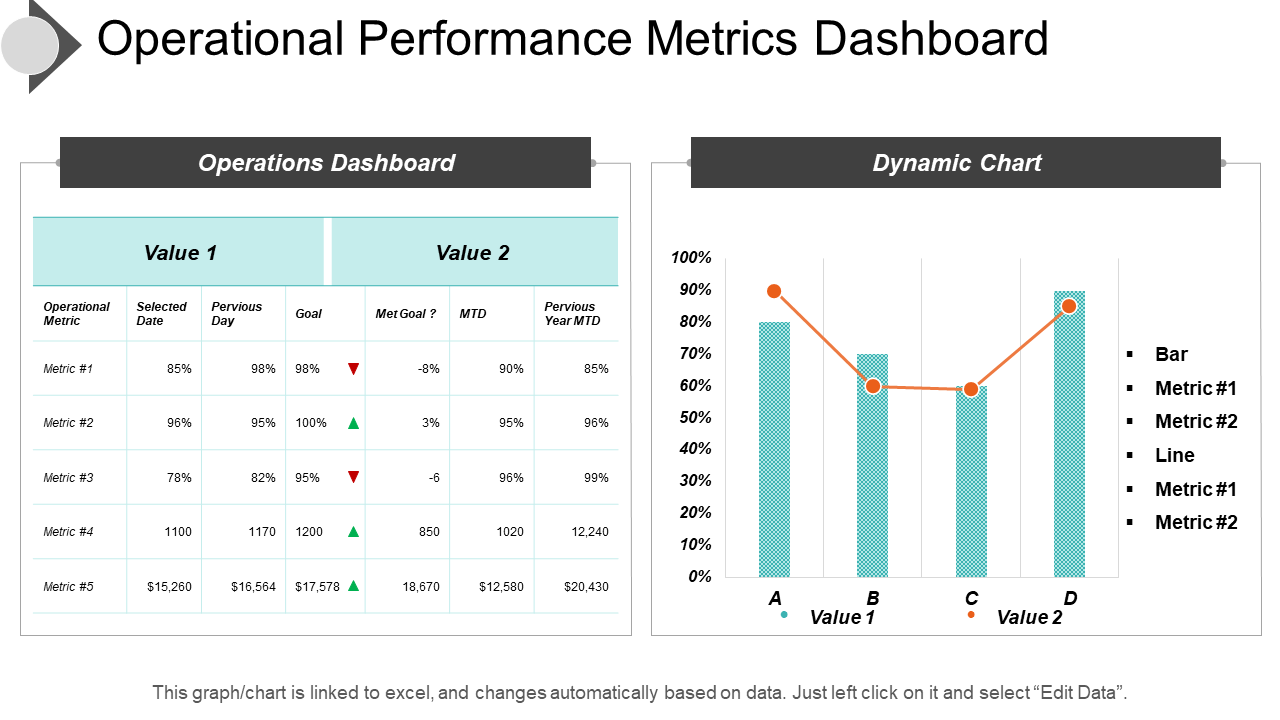
Template 6: Operational Performance Metrics Dashboard PPT Summary
If you are looking for an operational performance template with a simple layout and easy-to-record data, then we have just the product for you. This template from SlideTeam is not only minimalistic but also combines together a tabular layout and a graphical representation of the data together to help make your analysis super-easy to read and interpret. Get this template now if you want a simple method to measure your organization's performance and grow your business rapidly.
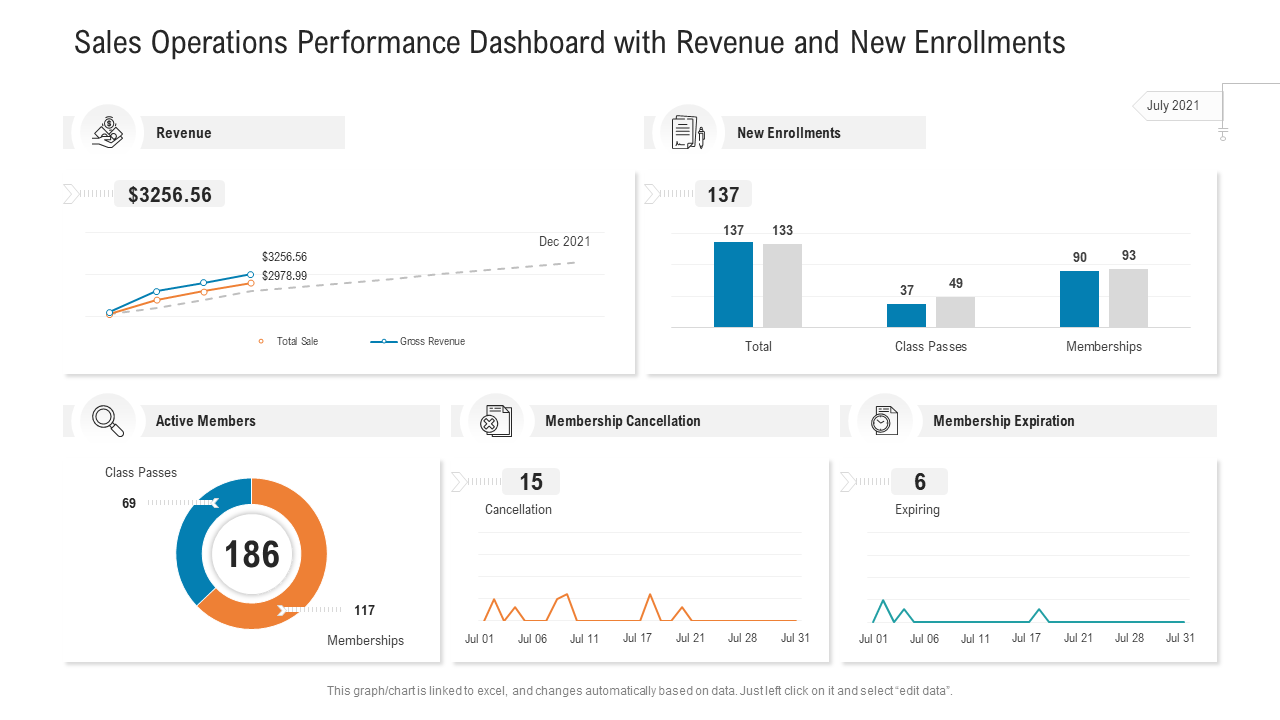
Template 7: Sales Operations Performance Dashboard With Revenue and New Enrollments
This template serves the needs of every sales manager who wants to keep track of the total revenue generated by their sales department. It also helps you monitor metrics to see how your subscriptions are selling. KPIs like new members added, membership cancellations and expirations, etc., give you an overview of the performance of your team. Such information can help you find loopholes in performance and also take action to rectify these. Get the PPT Template now to boost your team's sales figures!
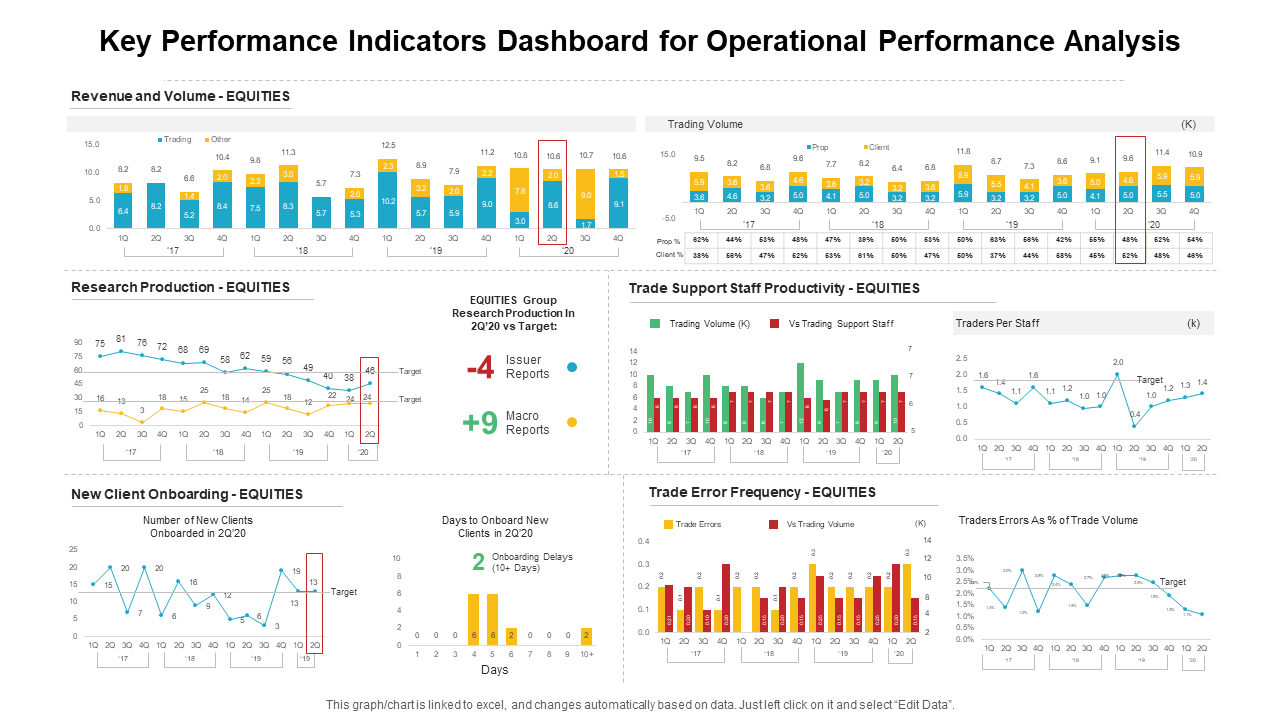
Template 8: Key Performance Indicators Dashboard for Operational Performance Analysis PPT Shapes
This template focuses on representing KPIs of an organization that engages in trading. This PowerPoint template covers metrics, such as trade support staff productivity, trade error frequency, new client onboarding, etc. Graphical representations also allow you to make instant comparisons between metrics on a quarterly basis as well as annually. If you need a template to set regulate your KPIs, get this template today.
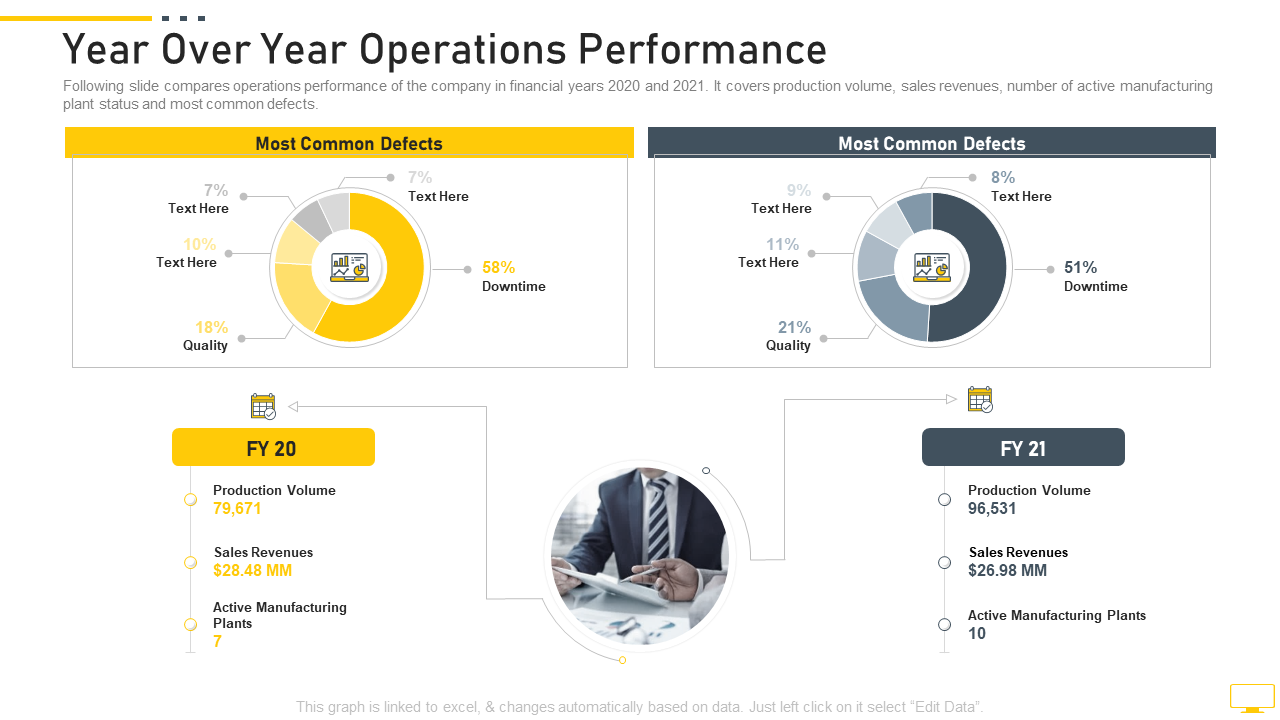
Template 9: Year-over-Year Operations Performance Digital Transformation of Workplace
Organizations often make comparisons between the metrics on the basis of time frames. Sometimes it is quarterly, yearly, or even five-yearly, and so on. The yearly comparisons are often what help you identify the loopholes and major changes. This template allows you to make annual performance comparisons for the manufacturing business. The metrics cover sales, production revenue as well and overall data on the efficiency of the plants. Get it for your manufacturing business ASAP!
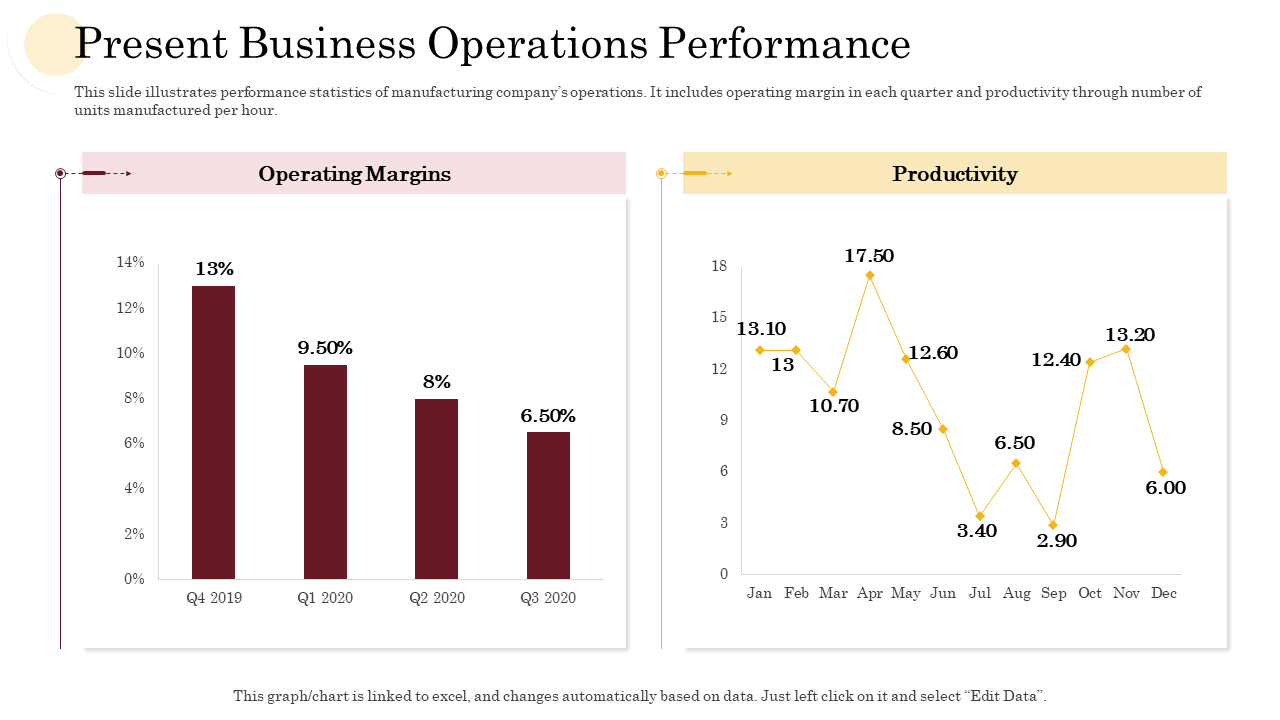
Template 10: Present Business Operations Performance Manufacturing Company Performance Analysis PPT Icon
Operating margins are one of the core metrics of any manufacturing business. It is an overview of the efficiency and profitability of the company's operations. In other words, it is the profit a company can generate only from its operations. This template covers this core metric along with the productivity analysis of a manufacturing business in simple and easy-to-understand graphical representations. The operating margin has been illustrated on a quarterly basis, whereas productivity has been illustrated monthly. Purchase the template to dissect the operations margin of your business now!
Revolutionize Your Operations
Operations performance is one of the most vital analyses for every business. It often becomes imperative to track every metric to analyze the true picture of the operations. It may sure be a daunting task, but it can easily be achieved with our fully customizable templates. These templates are incorporated with Excel spreadsheets, thus making it super-easy for you to represent your data through graphs and diagrams.
PS If you loved these templates, you must also check out our Top 10 operations proposal template by clicking here. These will help you neatly display your proposal and make them super-easy to present and understand.




 Customer Reviews

