


Annual Sales Report Dashboard Performance Product Presentation Analysis




Try Before you Buy Download Free Sample Product
 Impress Your
 Audience
 100%
100% Editable
 Save Hours
 of Time


Our Annual Sales Report Dashboard Performance Product Presentation Analysis are topically designed to provide an attractive backdrop to any subject. Use them to look like a presentation pro.
People who downloaded this PowerPoint presentation also viewed the following :
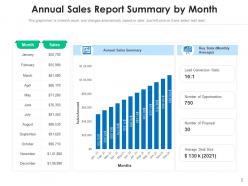
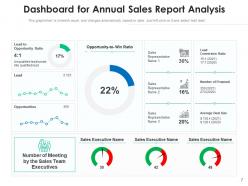
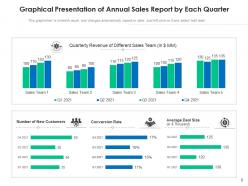
Annual Sales Report Dashboard Performance Product Presentation Analysis with all 12 slides:
Use our Annual Sales Report Dashboard Performance Product Presentation Analysis to effectively help you save your valuable time. They are readymade to fit into any presentation structure.

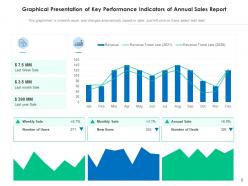
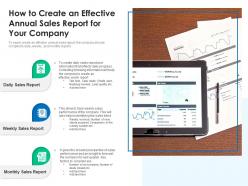
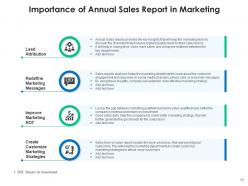

FAQs for Annual Sales Report Dashboard Performance
So conversion rates are huge - that's literally how you know if your team can close deals. I'd also look at average deal size and how long your sales cycle takes. Activity stuff matters too like calls and emails sent. Revenue per rep is obvious but you gotta track it. Honestly, pipeline velocity is my favorite metric because it shows the bigger picture instead of just final numbers. Win/loss ratios by rep tell you a lot, plus which lead sources actually work. Oh and sales cycle length - forgot to mention that earlier. Start with these basics and build from there when you spot what's missing.
So you want to predict future sales? Look at your historical data first - that's where the magic happens. Pull 2-3 years of past performance and hunt for patterns. Maybe December always goes crazy, or swimwear dies in winter (obviously). The cool thing is you'll separate what actually moves the needle from stuff that just seems important. Customer behavior, seasonal swings, product trends - they all tell a story. Honestly, it's way better than guessing. You'll spot which factors really drive results versus the noise everyone obsesses over.
Dude, customer segmentation is a game changer for analyzing sales performance. You get way past those basic "we hit our numbers" reports. Suddenly you can see which customer groups actually make you money and which ones... well, don't. Like maybe your enterprise deals take forever but they're worth way more, or younger customers prefer buying through your app instead of calls. Once you start breaking down your existing customers by different categories and comparing how they buy, you'll find some wild patterns. Honestly makes resource planning so much easier when you know what actually works.
Honestly, visual tools are a game changer for sales reports. Charts and graphs beat staring at endless Excel rows any day - your brain just processes visuals faster. You'll spot trends immediately, see who's crushing it vs who's not, which regions need help. My boss used to send these massive spreadsheets that nobody actually read lol. Now we've got dashboards that tell the whole story in seconds. Executives eat that stuff up too, way more than data dumps. Just pick your most important metric first and start there. Trust me, once you see the difference you won't go back.
Honestly, the biggest mistake is just staring at revenue numbers. You're missing so much context - like how long deals actually take or what activities move the needle. Don't compare random stuff either. Different territories or time periods need their own benchmarks, obviously. And here's the thing that drives me crazy - people analyze spreadsheets without ever talking to their sales team! Those folks know what's really going on. First figure out what "good" looks like for your situation. Then focus on the metrics that actually matter instead of drowning in data.
Okay so you really need to check how your sales stack up against what everyone else is doing. Otherwise you're just guessing if you're actually killing it or not. Like imagine thinking your 10% growth is amazing when everyone else hit 25% - that'd suck to find out later. Look at stuff like your conversion rates and deal sizes compared to industry benchmarks. You'll spot where you're actually weak instead of just feeling good about random numbers. Honestly, most people skip this step and wonder why they plateau. Grab 2-3 solid industry reports and check quarterly.
Track your conversion rates between each stage - lead gen, qualification, proposal, negotiation, close. Time spent in each phase matters too. Honestly, pipeline velocity is where you'll find the real insights since deals always seem to stall somewhere predictable. Your CRM should handle most of the heavy lifting on tracking this stuff. Look at win/loss by rep and deal size while you're at it. The money's in spotting bottlenecks though - once you see where prospects keep dropping off, you can actually fix those problem areas instead of just hoping things improve.
Get your sales team talking to you regularly - like monthly check-ins where they can tell you what's really happening out there. Customer pushback, territory issues, why deals are stalling. Numbers only show half the story, honestly. I'd do surveys asking about market conditions and lead quality too. Then weave that stuff directly into your reports alongside the hard data. You'll be amazed how much clearer things get when you combine their street-level insights with your metrics. Way better than just staring at spreadsheets wondering why conversion dropped.
Look, most teams see about 10-20% better numbers after 3-6 months of training. But here's the thing - generic stuff barely works. You need to focus on whatever your team actually sucks at, like handling objections or asking better discovery questions. That's where you'll really see conversion rates and deal sizes jump (not just more calls, which honestly doesn't matter much). Oh, and don't expect it to stick without follow-up coaching sessions. I'd grab your current metrics now, then check again in 90 days to see if it was worth the investment.
Honestly, CRMs are total lifesavers for sales analysis. All your lead tracking, deals, customer stuff - it automatically dumps into one spot instead of those nightmare spreadsheets we used to deal with. You'll get real pipeline visibility and conversion rates without guessing what's actually happening. The cool part? It shows you which activities actually make money, so you can figure out what's working. Oh, and make sure your team actually uses the thing consistently - garbage data in means garbage insights out. Real-time tracking beats manual updates every time.
SWOT's actually pretty solid for breaking down your sales game. You know - strengths, weaknesses, opportunities, threats. Sounds super basic but it makes you think through stuff you'd normally miss. Like maybe you keep losing to the same competitor but never connected the dots? Or your team has this amazing feature they barely mention to prospects (drives me crazy when that happens). The trick is actually doing something with what you find. Don't just make a pretty chart and forget about it. Pick maybe 2-3 things to fix next quarter and go from there.
Honestly? Monthly reviews are probably your best bet. Weekly feels way too intense unless you're selling something super time-sensitive. Quarterly works too - gives you more data to work with and you can spot bigger patterns. But here's the thing: whatever you pick, just stick with it. Consistency matters more than the perfect timeline. Monthly hits that sweet spot where you're not drowning in daily fluctuations but you're still catching trends early enough to actually do something about it. I'd go monthly first, see how it feels. You can always adjust later if it's too much or not enough.
Look at what's tanking first - maybe you need to drop prices or train your sales team better. For the stuff that's crushing it, throw more resources there or copy what's working in other areas. Geographic data is clutch here, honestly that's where I'd spend most of my time digging. You'll probably spot seasonal patterns too which helps with staffing and inventory. Oh, and don't just analyze - actually assign someone to own each action item with real deadlines. Otherwise it's just pretty charts that sit in a folder somewhere.
Honestly, you're gonna want to dig deeper than just revenue numbers. Track stuff like conversion rates, how fast they close deals, and client retention - that's where you'll spot the real talent. Some reps might look average on paper but they're crushing it with complex deals or keeping customers happy long-term. I learned this the hard way when we almost lost our best prospect developer because leadership only looked at total sales. Short bursts, long trends - the data shows who adapts fast and who builds solid relationships. Use that insight to promote people before they get poached.
Honestly, just be upfront about what you're tracking and why. Get consent first - people hate feeling spied on. Don't create unfair comparisons either - like comparing someone with a tough territory to someone with all the easy accounts, you know? That's just setting people up to fail. Focus on helping your team improve instead of catching them screwing up. The whole point should be coaching, not punishment. Oh, and don't let it turn into some toxic competition thing where everyone's backstabbing each other. Use the data to actually help people succeed.
-
Visually stunning presentation, love the content.
-
Professional and unique presentations.
-
Awesome presentation, really professional and easy to edit.
-
Best way of representation of the topic.
-
Appreciate the research and its presentable format.