



 0 Comment
 Customer Reviews

If you don’t track your sales team, you won’t know if you are heading in the right direction or in danger. Many companies have trouble observing what sales reps do each day. Consequently, businesses miss objectives, employees get frustrated and chances for earning money are lost.
That’s when our collection of sales dashboard templates can help. Our Sales Force Dashboard, Team KPI Dashboard, and Sales Rep Tracker templates help you understand data and take meaningful steps. If you want to see how your pipelines are performing, track how many reps are converting or build a leaderboard to encourage your team, our tools help. These slide help you track sales performance in the region, monitor your CRM activities and check on your sales targets.
Best of all, every template is 100% editable and customizable to match your specific business needs. Want to make your sales process more effective? You can learn more in our blog about how these templates can change the way you manage your sales.
Want to transform your sales chaos into crystal-clear insights that actually drive results? Discover the game-changing dashboard templates that successful sales managers swear by and watch your team's performance soar.
Let’s begin!
Template 1: Sales Team Performance Management Dashboard
Use this complete deck of a bundle in the form of a template to monitor your sales process which provides reports on revenue patterns, the performance of your team and achievements by individual salespeople. Use the dashboard to review lead generation, examine conversion rates and check the average time it takes your sales team to respond. The Sales Force Dashboard lets you see how each person is meeting their quota and tracks their personal performance. Important parts of the system are pipeline reports, data on territory sales and the ability to track team revenues. By including monthly team reports and rep conversion rates, the dashboard is crucial for today’s sales management.

Template 2: Quarterly Sales Team Performance Dashboard PowerPoint Template
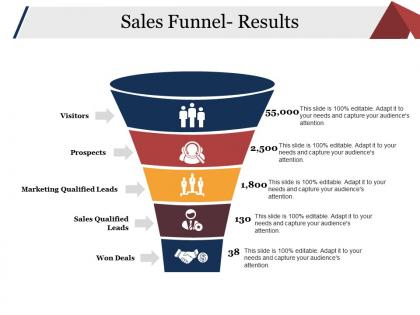
Track sales each quarter using this template that marks deal progress, revenue goals and the win rate in one place. Sales Rep Tracker for management teams is displayed through quarterly comparisons and a sales funnel diagram. This Team Sales Metrics give you access to pipeline data as well as how sales are going in territories. The dashboard tracks sales targets and shows you how much of your quota has been achieved. Leaderboard, team revenue and sales team efficiency are features to have. By using this tool, organizations can keep up their performance and find out where they need to improve each quarter.

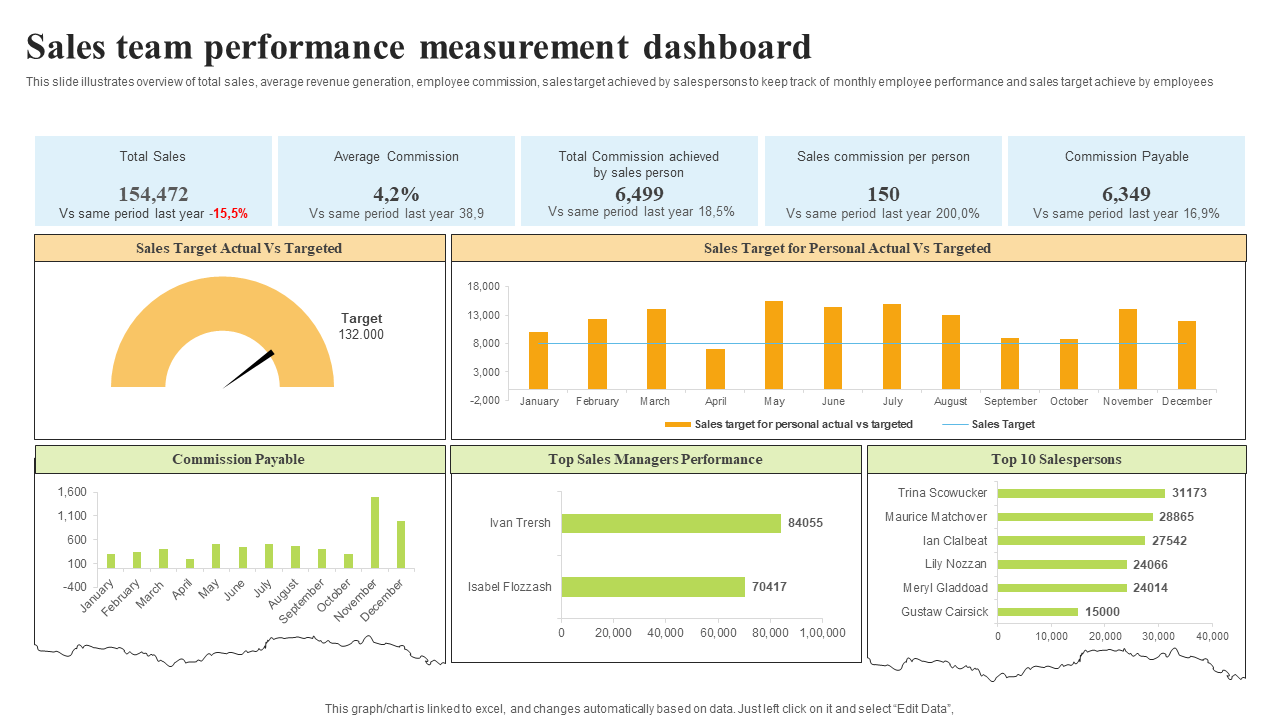
Template 3: Sales Team Performance Measurement Dashboard PowerPoint Template
You can check the effectiveness of your sales team by keeping an eye on commissions, monitoring their targets and ranking them individually. With this Rep Activity Tracker, you can see the total sales, average commission and personal performance stats for each team member. The dashboard is both a Sales Productivity Panel and a reliable KPI Dashboard for teams. Important features are pipeline performance reports, tracking sales targets and generating team reports every month. The user interface includes the option to analyze territory sales performance as well as see a CRM activity dashboard. It gives sales team leaders important metrics to review performance and plan.
Template 4: Sales Team Performance Measure Dashboard PPT Template
Check the success of your sales team by looking at closing ratios, how leads are tracked and how often they follow up with customers. The Sales Goal Tracker makes it easy to see your key performance and tracks your progress in detail. The dashboard is a complete Individual Performance Monitor and an effective tool for monitoring team sales metrics. Pipeline performance reports, analyzing rep conversions and checking on sales team performance are important features. Territory sales results are shown together with a CRM activity dashboard in the interface. Managers use this tool to review sales targets and track progress toward achieving their goals.

Tired of drowning in spreadsheets while your competitors race ahead with smart reporting strategies? Explore these 7 powerful dashboard templates with real examples that turn raw data into your competitive advantage.
Template 5: Quarterly Sales Team Performance Analysis Dashboard PowerPoint Template
Look at how sales progress over the quarters by studying target achievement, who the customers are and the company’s revenue. The tool helps by displaying information on customer lifetime value, costs involved in new customers and quarterly progress. Salesforce Dashboard functions as a Sales Productivity Panel and also gives complete Team KPI Dashboard support. Important aspects are reports on the pipeline, sales performance in each territory and a close look at how the sales team works. Both a leaderboard dashboard and a team revenue tracker can be found in the interface. The tool helps you analyze sales targets and review team reports each month, making it important for planning and reviewing performance over each quarter.

Template 6: Sales Team Performance Tracking Dashboard Response to User Concerns PPT Template
Analyze team performance by checking detailed reports, looking at how quickly your team is responding and finding out how happy your customers are. This dashboard is designed to watch for new conversations, measure help given to customers and track revenue turnover. It acts as a complete Call and Meeting Tracker and also provides valuable Team Sales Metrics. Important parts are pipeline performance reports, tracking how the sales team works and analyzing results in different territories. Both monthly team reporting and tracking rep conversion rates are available through the interface. The tool’s sales target monitoring helps businesses that care about managing customers and supporting teams.

Template 7: Sales Team Performance Management KPI Dashboard Template
Show how each person has performed with weekly performance tracking, a look at their target percentages and personal rankings. This Individual Performance Monitor shows the weekly sales of each team member along with their achievement of sales targets. The dashboard works very well as a Leaderboard Dashboard and is also a dependable tool for tracking sales reps. Important features on the CRM system are pipeline performance, quota achievement and sales team efficiency data. The interface provides both territory sales figures.

Template 8: KPI Dashboard for Sales Team Performance PowerPoint Template
Follow important sales measures by looking at account management, handling orders and studying growth in each market segment. The platform presents total accounts, monthly orders and average contracts, as well as tools for tracking growth. A Sales Productivity Panel and a Rep Activity Tracker are functions of the dashboard. Pipeline performance reports, territory sales performance analysis and measurements of the sales team’s efficiency are important. There is a win rate by rep tracker along with a CRM activity dashboard on the interface. With this tool, you can track sales targets and get a monthly report on your team which makes it perfect for analyzing both your strategy and the market.

Template 9: Dashboard for Tracking Sales Team Performance PowerPoint Template
Understand how each sales rep performs by looking at their sales numbers, evaluating their goals and using percentages. This tracker shows each team member’s sales, compares those to their targets and displays the percentage they achieved. It acts as a good Quota Achievement Dashboard and also reliably monitors each person’s performance. Aspects outlined are pipeline performance, a leaderboard dashboard and how efficiently sales teams are working. The interface includes sales data for territories as well as the ability to track team revenue. It helps oversee sales targets and generate monthly team reports which is great for monitoring and improving team performance.

Template 10: KPI Dashboard to Assess Sales Team Performance PPT Slide
To judge how the sales team is performing, look at detailed invoices, rank the reps and watch the sales cycle. The analytical Team KPI Dashboard includes information on top sales representatives, order tracking and response time. The system works like a full Sales Force Dashboard and is capable of generating a Pipeline Performance Report. Features you should have are territory sales performance metrics, sales team effectiveness analysis and a CRM activity dashboard. The system includes both win rate by rep monitoring and call and meeting tracking. With this tool, sales targets can be tracked and a monthly team report is generated, helping you evaluate performance and make better plans.

Transform Your Sales Management Today
The ten templates included help your sales team move from good performance to exceptional results. Every template comes with features that are meant to address specific problems, whether you’re working on a single rep, checking the quarterly results or managing customer relationships. If these tools are set up correctly, they will allow you to find your top performers, solve your weak points and build a culture based on data that always exceeds goals. Begin by creating a template for your main challenge and add more as you go.
PS Ready to stop guessing about what's working and start tracking what actually matters for sales success? Unlock these proven performance templates that help you identify top performers and boost your entire team's results.
FAQs on Balanced Scorecard Strategy Map PPT Templates
1. What is a sales performance dashboard?
A sales performance dashboard is a visual tool that tracks and displays key sales metrics in real-time. It monitors individual rep activities, team achievements, and revenue goals through charts and graphs. These dashboards help managers make data-driven decisions by providing instant insights into sales productivity and performance trends.
2. How do you measure sales team performance?
Sales team performance is measured through key metrics like quota achievement, conversion rates, and revenue targets. Track individual rep activities, pipeline progression, and customer acquisition costs for comprehensive analysis. Monitor response times, win rates, and territory performance to identify strengths and areas needing improvement across your team.
3. How do you create a team performance dashboard?
Creating a team performance dashboard involves selecting relevant KPIs like sales targets, conversion rates, and individual achievements. Use templates that display revenue tracking, lead generation, and rep activity in visual formats. Customize the dashboard to include team rankings, monthly reports, and goal progress to ensure all critical metrics are easily accessible.