


Sales Rep Performance Measuring Dashboard Improving Planning Segmentation


Try Before you Buy Download Free Sample Product
 Impress Your
 Audience
Editable
of Time


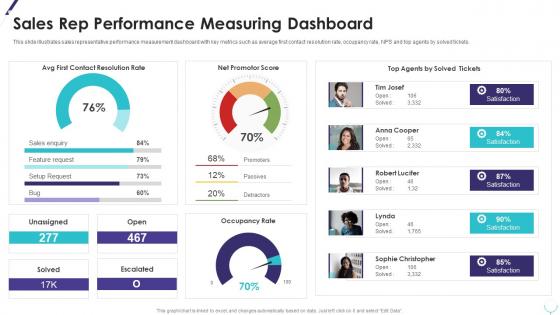
This slide illustrates sales representative performance measurement dashboard with key metrics such as average first contact resolution rate, occupancy rate, NPS and top agents by solved tickets.
People who downloaded this PowerPoint presentation also viewed the following :
Sales Rep Performance Measuring Dashboard Improving Planning Segmentation with all 6 slides:
Use our Sales Rep Performance Measuring Dashboard Improving Planning Segmentation to effectively help you save your valuable time. They are readymade to fit into any presentation structure.


FAQs for Sales Rep Performance Measuring Dashboard
Key performance indicators for sales performance analytics include conversion rates, sales cycle length, average deal size, lead-to-customer ratios, and revenue per salesperson. These metrics streamline performance evaluation by identifying bottlenecks, optimizing resource allocation, and enhancing forecasting accuracy, with many organizations finding that strategic KPI monitoring ultimately delivers improved sales efficiency and competitive advantage.
Sales performance analytics drives strategic decision-making by identifying top-performing channels, revealing customer acquisition patterns, and pinpointing revenue optimization opportunities across territories and product lines. Through comprehensive data analysis, organizations streamline resource allocation, enhance forecasting accuracy, and accelerate market expansion strategies, with many companies finding that analytics-driven insights ultimately deliver competitive advantage and sustainable growth.
Data visualization transforms complex sales performance metrics into clear, actionable insights through interactive dashboards, trend charts, heat maps, and comparative graphs that reveal patterns instantly. These visual tools enable sales managers and executives to quickly identify top performers, spot declining territories, track quota attainment, and forecast pipeline health, ultimately delivering faster decision-making and more strategic resource allocation across growing sales organizations.
Machine learning and AI enhance sales forecasting accuracy by analyzing historical data patterns, identifying seasonal trends, and processing real-time market signals to predict future performance. These technologies enable sales teams to incorporate customer behavior analytics, lead scoring algorithms, and external market factors, ultimately delivering more precise revenue projections and strategic resource allocation across quarters.
Common pitfalls include relying on incomplete data sets, misinterpreting correlation as causation, focusing on vanity metrics over actionable insights, ignoring seasonal trends, and analyzing data in silos without cross-departmental context. These challenges often lead organizations to make strategic missteps in resource allocation and forecasting, with many businesses finding that establishing clear analytical frameworks and regular data validation processes ultimately delivers more accurate decision-making and improved sales outcomes.
Customer segmentation insights significantly enhance sales performance analysis by revealing performance patterns across different customer groups, identifying high-value segments, and uncovering conversion rate variations by demographics or behavior. Through targeted analytics, organizations can optimize resource allocation, tailor sales strategies for specific segments, and prioritize efforts on the most profitable customer groups, ultimately delivering improved conversion rates and revenue growth.
**INPUT**: What tools are most effective for collecting and analyzing sales data? **OUTPUT**: Effective sales data collection and analysis tools include CRM platforms like Salesforce, business intelligence software like Tableau, marketing automation systems, call tracking solutions, and integrated analytics dashboards. These technologies streamline performance monitoring by consolidating lead sources, tracking conversion rates, and identifying revenue patterns, with many organizations finding that strategic combinations ultimately deliver enhanced forecasting accuracy and competitive advantage. [Word count: 60 words]
Real-time sales data tracking enhances team performance by providing instant visibility into pipeline changes, deal progression, and individual rep activities, enabling managers to address challenges immediately rather than waiting for monthly reports. This immediate access allows teams to adjust strategies mid-cycle, capitalize on emerging opportunities, and maintain consistent momentum, ultimately delivering faster deal closures and improved quota attainment.
Best practices for setting up a sales performance dashboard include defining clear KPIs, ensuring real-time data integration, creating role-based views, implementing interactive filtering, and establishing automated reporting schedules. These approaches streamline decision-making by providing actionable insights, enhancing visibility across sales teams, and enabling managers to identify performance gaps quickly, ultimately delivering improved forecasting accuracy and accelerated revenue growth.
Sales training effectiveness is measured through analytics by tracking performance metrics before and after training, monitoring skill application rates, analyzing conversion improvements, and measuring time-to-competency for new hires. These analytics enable organizations to identify which training modules deliver the strongest ROI, with many sales teams finding that data-driven training optimization increases quota attainment and reduces onboarding time significantly.
Market trend analysis significantly enhances sales performance evaluation by providing contextual benchmarks, identifying seasonal patterns, and revealing competitive positioning relative to industry movements. Through comprehensive trend analysis, organizations can distinguish between performance issues stemming from market conditions versus internal factors, ultimately enabling more accurate forecasting and strategic adjustments that drive sustainable revenue growth.
Cross-team collaboration enhances sales performance insights by integrating diverse data sources, validating metrics across departments, and ensuring comprehensive context for sales trends. When sales teams work with marketing, finance, and operations, they gain deeper understanding of customer journeys, campaign effectiveness, and operational constraints, ultimately delivering more accurate forecasting and strategic decision-making capabilities.
**INPUT**: What ethical considerations should be taken into account when using customer data for sales analytics? **OUTPUT**: Key ethical considerations include obtaining explicit consent, ensuring data transparency, maintaining robust security measures, respecting privacy boundaries, and providing opt-out options. Organizations must balance analytical insights with customer trust, particularly in sectors like healthcare and financial services, where data sensitivity is heightened, ultimately delivering competitive advantage while preserving customer relationships and regulatory compliance.
Sales performance data should be reviewed daily for pipeline activities and deal progress, weekly for individual performance metrics, monthly for team and territory analysis, and quarterly for strategic planning and goal adjustments. This multi-tiered approach enables sales managers to identify trends early, address performance gaps quickly, and maintain accurate forecasting, with many organizations finding that real-time dashboards combined with structured review cycles significantly enhance decision-making and ultimately drive revenue growth.
Key factors include market share analysis, revenue growth rates, customer acquisition costs, sales cycle lengths, and conversion rates across different channels. These metrics enable organizations to identify performance gaps and competitive advantages by comparing pricing strategies, territory coverage, and customer retention rates, with many companies finding that systematic benchmarking ultimately delivers strategic insights for optimizing sales processes and market positioning.
-
Colors used are bright and distinctive.
-
Topic best represented with attractive design.