


Achieving Sales Target Sales Performance And Sales Kpi Dashboard Snapshot Ppt Icon


Try Before you Buy Download Free Sample Product
 Impress Your
 Audience
Editable
of Time


As a sales manager, you will always want to catch the beat of your sales team’s progress. Now you can easily see what needs your attention with this Sales Target Sales Performance and Sales KPI Dashboard Template. Achieving sales targets can be tough but to display them in the form of presentation reports can be even harder. That is why it is very important to create the Sales Target PowerPoint Presentation in a way that can quickly express important statistics for senior management, subordinates and employees. To make your Sales Performance Layout easy to grasp and more lively, you can use this ready to use excel linked Sales Dashboard PowerPoint Template. Help your coworkers understand at what pace the sales revenues are increasing or decreasing. This layout will better help the sales team to manage the list of sales performance indexes. Our Sales KPI Dashboard Presentation will exhibit your ability and help you in analyzing the result oriented sales performance. These professionally designed Sales Targets PowerPoint Templates are 100% customizable. Just download this awesome Sales Dashboard PPT Format and inspire your colleagues through your presentation. As a sales manager, you will always want to catch the beat of your sales team’s progress. Now you can easily see what needs your attention with this Sales Target Sales Performance and Sales KPI Dashboard Template. Achieving sales targets can be tough but to display them in the form of presentation reports can be even harder. That is why it is very important to create the Sales Target PowerPoint Presentation in a way that can quickly express important statistics for senior management, subordinates and employees. To make your Sales Performance Layout easy to grasp and more lively, you can use this ready to use excel linked Sales Dashboard PowerPoint Template. Help your coworkers understand at what pace the sales revenues are increasing or decreasing. This layout will better help the sales team to manage the list of sales performance indexes. Our Sales KPI Dashboard Presentation will exhibit your ability and help you in analyzing the result oriented sales performance. These professionally designed Sales Targets PowerPoint Templates are 100% customizable. Just download this awesome Sales Dashboard PPT Format and inspire your colleagues through your presentation. Your team is keen to hear your views. Satisfy their thirst with our Achieving Sales Target Sales Performance And Sales Kpi Dashboard Ppt Icon.
People who downloaded this PowerPoint presentation also viewed the following :
Content of this Powerpoint Presentation
Description:
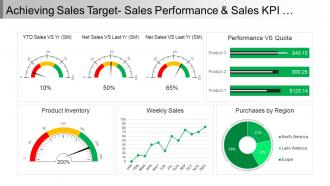
The image is of a sales dashboard PowerPoint slide titled "Achieving Sales Target- Sales Performance & Sales KPI." It features a collection of graphical elements that provide an at-a-glance view of various sales-related metrics.
The top row shows three gauge charts:
1. YTD Sales VS Yr ($M):
This chart indicates Year-To-Date sales compared to the previous year, shown at 10%, suggesting a possible shortfall or just the beginning of the year.
2. Net Sales VS Last Yr ($M):
Reflecting net sales, this chart shows 50%, which could mean that sales are at half of the target or last year's figures.
3. Net Sales VS Last Yr ($M):
Another net sales gauge, marked at 65%, potentially indicating progress towards the target.
The bottom row has three different charts:
1. Product Inventory:
This gauge chart shows an inventory level at 200%, indicating a surplus of inventory or overstock compared to what was planned or expected.
2. Weekly Sales:
A line chart tracking sales performance over a year, showing an upward trend, suggesting increasing sales volume as the year progresses.
3. Purchases by Region:
A donut chart breaks down purchases by region, with North America accounting for the largest share at 58%, followed by Latin America and Europe.
To the right of the gauges, there's a bar chart titled "Performance VS Quota," presenting three products against their sales quotas, with Product 1 exceeding its quota at $120.14, followed by Product 2 and Product 3 at lower values.
Overall, this dashboard provides key performance indicators (KPIs) for sales, allowing the viewer to quickly assess various aspects of sales performance, from overall progress to regional distribution. It's designed to be a visual tool for managers and teams to monitor and discuss sales strategies.
Use Cases:
This sales dashboard is an essential tool for visualizing key performance indicators and can be customized for a variety of sectors focusing on product sales and market reach.
1. Retail:
Use: Tracking product sales and inventory levels.
Presenter: Sales Managers.
Audience: Store Managers and Sales Teams.
2. Automotive:
Use: Monitoring car model sales and regional dealership performance.
Presenter: Regional Sales Directors.
Audience: Dealership Owners and Sales Staff.
3. Pharmaceutical:
Use: Analyzing medication sales trends and stock levels.
Presenter: Pharma Sales Analysts.
Audience: Pharma Representatives and Distributors.
4. Technology:
Use: Measuring software and hardware sales progress.
Presenter: Product Managers.
Audience: Sales Teams and Tech Partners.
5. Real Estate:
Use: Assessing property sales and regional market performance.
Presenter: Real Estate Brokers.
Audience: Sales Agents and Real Estate Developers.
6. Consumer Goods:
Use: Evaluating fast-moving consumer goods (FMCG) sales and stock.
Presenter: Brand Managers.
Audience: Retail Partners and Marketing Teams.
7. Financial Services:
Use: Presenting financial product sales and client acquisition metrics.
Presenter: Financial Advisors.
Audience: Sales Representatives and Branch Managers.
Achieving Sales Target Sales Performance And Sales Kpi Dashboard Snapshot Ppt Icon with all 5 slides:
Get the bonds of friendship to grow with our Achieving Sales Target Sales Performance And Sales Kpi Dashboard Snapshot Ppt Icon. It will help build further goodwill.
FAQs for Achieving Sales Target Sales Performance And Sales Kpi Dashboard
Track both the doing stuff AND the results - that's key. Conversion rates at each funnel stage, average deal size, how long your sales cycle takes, total revenue obviously. Pipeline velocity is huge too (how fast deals actually move). But honestly, don't sleep on activity metrics like calls made, emails sent, meetings booked. Those'll show you if someone's about to tank before their revenue numbers do. Pick maybe 3-5 metrics that actually matter for your business and check them weekly. More than that gets overwhelming fast.
Dude, team structure is massively underrated for sales performance. Get the right people in the right spots and territories? Revenue shoots up. But mess it up and you're basically hemorrhaging money - I've seen it happen too many times. You gotta match your structure to how you actually sell and who you're selling to, not just wing it with whoever's available. Oh, and don't just set it once and forget about it. Check every few months if your setup still makes sense or if you're stuck with some legacy mess that isn't working anymore.
Dude, sales tech is seriously a lifesaver. Your CRM does all the follow-up reminding so you don't forget prospects (guilty of that way too often). Analytics show you who's actually gonna buy vs who's just window shopping. Email automation handles the repetitive stuff - honestly saved my sanity. Video calls and LinkedIn let you hit up way more people than just cold calling random numbers all day. I swear salespeople back in the day must've been exhausted doing everything manually. Just don't go overboard with tools that end up eating more time than they save you.
Start with industry reports - Salesforce Research and HubSpot's State of Sales are solid bets. Your industry associations probably publish annual benchmarks too. I know it feels like doing homework, but honestly the data's pretty eye-opening once you dive in. Just make sure you're comparing against similar company sizes because startup metrics are gonna look wildly different than enterprise stuff. Focus on maybe 3-4 core metrics instead of trying to benchmark everything. Way less overwhelming that way.
So the best reps I've worked with all share a few things. First, they're genuinely curious about what's actually bugging their prospects - not just fishing for pain points to pounce on. Second thing? They bounce back from "no" way faster than everyone else. Like, rejection just rolls right off them. Most importantly though, they stick to their systems religiously. Track everything, review what's working, stay consistent with activity even when deals tank. Oh and honestly? Their questions are just so much better - they actually listen instead of waiting to jump in with their pitch. Role-play helps tons if you're coaching people on this stuff.
Honestly, customer feedback is like getting the answers to the test beforehand. When people tell you why they didn't buy or what made them pick you, that's gold. You can tweak your pitch, handle objections better, and focus on what's actually working. The trick is being systematic about collecting it though - can't just hope people volunteer comments. I usually send quick surveys after calls or follow-ups via email. It's crazy how much you can improve your close rate just by listening to what went wrong (or right) in previous conversations.
Have one-on-ones first to figure out what's really going on - could be skills, could be personal drama messing with their head. Break down big goals into smaller wins they can actually hit. Celebrate those publicly too. I've seen recognition work magic honestly. Get them shadowing your best people or doing joint calls together. Maybe their territory sucks or they're getting garbage leads? That stuff matters more than people think. Training, motivation, or better support - you gotta diagnose which one they actually need. Just don't let it drag on forever.
Dude, sales training actually works - like really works. I've seen teams bump revenue 10-20% when they do it right. Your reps get way more confident, close better, handle pushback like pros. The weird thing? Soft skills training often beats product training, which honestly caught me off guard at first. Plus people stick around longer when you invest in them, so you're not always training rookies. Oh and don't try to fix everything at once - figure out where your team sucks most and start there.
Honestly, data analytics will show you stuff you'd never notice otherwise. Like which lead sources actually convert (not just bring in volume), what times prospects respond, or which objections mean you're close to a yes. Your gut lies sometimes - numbers don't. Track conversion rates at each pipeline stage and analyze your best deals for patterns. See where people drop off most. But don't go crazy with dashboards right away. Pick maybe 2-3 metrics to watch consistently first. Once you spot what's working, just do more of that.
Honestly, SMART goals are a game-changer because your team finally knows what they're actually aiming for. No more of that "just sell more" nonsense that helps nobody. When goals hit all five boxes - Specific, Measurable, Achievable, Relevant, Time-bound - your reps can see their wins stacking up, which keeps them motivated. You'll catch issues before they blow up your whole quarter too. I learned this the hard way at my last job. Just grab your current goals and make sure they answer what, how much, and by when. Trust me, it's worth the effort.
Look, building relationships is basically your safety net in sales. Trust me on this one. Customers who actually like you don't just disappear to competitors - they stick around, refer friends, and honestly make your life way easier. No more endless cold calls to strangers who hang up on you. Good relationships mean people will be straight with you about what they need. They'll even give you a heads up about deals before anyone else knows. The whole thing just becomes more human, you know? My advice? Actually listen to them beyond whatever they're buying today.
Set super clear expectations from day one. Then do weekly one-on-ones focused on actual numbers - not those vague "how's it going" chats that accomplish nothing. Put everyone's metrics on a dashboard or bring them up in team meetings. Honestly, peer pressure works wonders. Don't wait for quarterly reviews if someone's missing targets - call it out right away. Oh, and pipeline reviews are huge. Have each person walk through their deals and commit to what they'll do next. Consistency is everything here.
Honestly, just start with LinkedIn - way easier than juggling multiple platforms at once. Have your reps spend maybe 30% of their prospecting time there researching people before calls and actually engaging with their posts. Share stuff that makes them look smart in their field. Track how much social engagement you're getting alongside your usual numbers. Cold calling random people is pretty brutal these days. This relationship-building approach through social media works so much better, though it takes patience. Set up content calendars that match your sales timing, and maybe I'm biased but I'd train everyone on one platform really well before expanding.
Dude, segmentation is huge - you stop doing the same boring pitch for everyone. Break your market down by stuff like company size or industry, then totally switch up your messaging for each group. Startups need a different vibe than big enterprise deals, you know? Different budgets, different decision makers, whole different timeline. I'd honestly just pick your top 2-3 customer types first and build separate playbooks. Way easier than trying to do everything at once. Once you nail it though, your close rates will thank you.
Dude, get those teams in a room together every week. Marketing needs to share which leads are actually hot, and sales has to tell them what objections keep coming up. When marketing knows the real pushback sales is getting, they can fix their messaging. Plus sales won't waste time on cold leads if marketing shows them engagement scores. I swear, most companies treat these departments like they're on different planets. Set some shared goals first - otherwise you're just spinning your wheels. Once they're actually working together, your conversion rates will thank you.
-
Good research work and creative work done on every template.
-
Perfect template with attractive color combination.