Powerpoint Templates and Google slides for Kpi Dashboard
Save Your Time and attract your audience with our fully editable PPT Templates and Slides.
-
 Supply Chain Kpi Dashboard Powerpoint Presentation Slides
Presenting our supply chain KPI dashboard PowerPoint presentation slides. This PowerPoint design contains fifty-nine slides in it which can be completely customized and edited. It is available for both standard as well as for widescreen formats. This PowerPoint template is compatible with all the presentation software like Microsoft Office, Google Slides, etc. You can download this PPT layout from below.
-
 Hospitality management industry kpi and dashboards powerpoint presentation slides
Presenting our Hospitality Management Industry KPI And Dashboards PowerPoint Presentation Slides. This is a 100% editable and adaptable PPT slide. You can save it in different formats like PDF, JPG, and PNG. It can be edited with different colour, font, font size, and font type of the template as per your requirements. This template supports the standard (4:3) and widescreen (16:9) format. It is also compatible with Google slides.
-
 Project portfolio management kpi and dashboard powerpoint presentation slides
Presenting our content ready Portfolio Management KPI And Dashboard PowerPoint Presentation Slides. This PowerPoint deck comprises twenty-five fully editable slides. These slides support the standard(4:3) and widescreen(16:9) viewing angles. Alter the color, text, and font size of these layouts. This PPT slideshow is compatible with Google Slides. Convert these templates into various images or document formats like JPEG or PDF.
-
 Financial Assets Management Kpi And Dashboard Powerpoint Presentation Slides
This complete deck focuses on Financial Assets Management Kpi And Dashboard Powerpoint Presentation Slides and consists of professionally designed templates with suitable graphics and appropriate content. This deck has a total of twenty-five slides. Our designers have created customizable templates for your convenience. You can make the required changes in the templates like color, text and font size. The presentation is fully supported by Google Slides. It can be easily converted into JPG or PDF format. When you download this presentation by clicking the download button, you get the presentation in both standard and widescreen formats.
-
 Portfolio investment kpis and dashboard powerpoint presentation slides
This complete deck is oriented to make sure you do not lag in your presentations. Our creatively crafted slides come with apt research and planning. This exclusive deck with twenty-five slides is here to help you to strategize, plan, analyze, or segment the topic with clear understanding and apprehension. This slide is 100% editable in PowerPoint. You can alter the font type, size, diagram color, background color, etc. The presentation can be saved in multiple image formats such as JPEG, PNG, and PDF This presentation deck can be used by all professionals, managers, individuals, internal-external teams involved in any company organization.
-
 Portfolio management kpi and dashboard powerpoint presentation slides
Presenting our content ready Portfolio Management KPI And Dashboard PowerPoint Presentation Slides. This PowerPoint deck comprises twenty-five fully editable slides. These slides support the standard(4:3) and widescreen(16:9) viewing angles. Alter the color, text, and font size of these layouts. This PPT slideshow is compatible with Google Slides. Convert these templates into various images or document formats like JPEG or PDF.
-
 Hospitality Management KPI And Dashboard Powerpoint Presentation Slides
This complete deck focuses on Hospitality Management KPI And Dashboard Powerpoint Presentation Slides and consists of professionally designed templates with suitable graphics and appropriate content. Our designers have created customizable templates for your convenience. You can make the required changes in the templates like color, text and font size. Other than this, content can be added or deleted from the slide as per the requirement. The templates are compatible with Google Slides so it can be easily accessible. It can be saved into various file formats like PDF, JPG. And PNG. It is available in both standard and widescreen formats.
-
 Finance Portfolio Management KPIs And Dashboard Powerpoint Presentation Slides
Presenting our Finance Portfolio Management KPIs And Dashboard PowerPoint Presentation Slides. This is a 100% editable and adaptable PPT slide. You can save it in different formats like PDF, JPG, and PNG. It can be edited with different color, font, font size, and font type of the template as per your requirements. This template supports the standard (4:3) and widescreen (16:9) format. It is also compatible with Google slides.
-
 Safety KPI Dashboard Powerpoint Ppt Template Bundles
If you require a professional template with great design,then this Safety KPI Dashboard Powerpoint Ppt Template Bundles is an ideal fit for you. Deploy it to enthrall your audience and increase your presentation threshold with the right graphics,images,and structure. Portray your ideas and vision using sixteen slides included in this complete deck. This template is suitable for expert discussion meetings presenting your views on the topic. With a variety of slides having the same thematic representation,this template can be regarded as a complete package. It employs some of the best design practices,so everything is well-structured. Not only this,it responds to all your needs and requirements by quickly adapting itself to the changes you make. This PPT slideshow is available for immediate download in PNG,JPG,and PDF formats,further enhancing its usability. Grab it by clicking the download button.
-
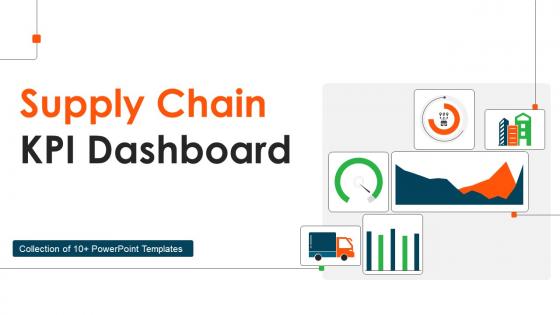 Supply Chain KPI Dashboard Powerpoint Ppt Template Bundles
Deliver a lucid presentation by utilizing this Supply Chain KPI Dashboard Powerpoint Ppt Template Bundles. Use it to present an overview of the topic with the right visuals, themes, shapes, and graphics. This is an expertly designed complete deck that reinforces positive thoughts and actions. Use it to provide visual cues to your audience and help them make informed decisions. A wide variety of discussion topics can be covered with this creative bundle such as Freight Bill KPI, Warehouse Capacity, Average Purchase Value, Supply Chain Metrics, Total Savings. All the twelve slides are available for immediate download and use. They can be edited and modified to add a personal touch to the presentation. This helps in creating a unique presentation every time. Not only that, with a host of editable features, this presentation can be used by any industry or business vertical depending on their needs and requirements. The compatibility with Google Slides is another feature to look out for in the PPT slideshow.
-
 Risk KPI Dashboard Powerpoint Ppt Template Bundles
Deliver a lucid presentation by utilizing this Risk KPI Dashboard Powerpoint Ppt Template Bundles. Use it to present an overview of the topic with the right visuals, themes, shapes, and graphics. This is an expertly designed complete deck that reinforces positive thoughts and actions. Use it to provide visual cues to your audience and help them make informed decisions. A wide variety of discussion topics can be covered with this creative bundle such as fourteen. All the fourteenslides are available for immediate download and use. They can be edited and modified to add a personal touch to the presentation. This helps in creating a unique presentation every time. Not only that, with a host of editable features, this presentation can be used by any industry or business vertical depending on their needs and requirements. The compatibility with Google Slides is another feature to look out for in the PPT slideshow.
-
 Devops KPI Metrics Dashboard Powerpoint PPT Template Bundles
If you require a professional template with great design,then this Devops KPI Metrics Dashboard Powerpoint PPT Template Bundles is an ideal fit for you. Deploy it to enthrall your audience and increase your presentation threshold with the right graphics,images,and structure. Portray your ideas and vision using twelve slides included in this complete deck. This template is suitable for expert discussion meetings presenting your views on the topic. With a variety of slides having the same thematic representation,this template can be regarded as a complete package. It employs some of the best design practices,so everything is well-structured. Not only this,it responds to all your needs and requirements by quickly adapting itself to the changes you make. This PPT slideshow is available for immediate download in PNG,JPG,and PDF formats,further enhancing its usability. Grab it by clicking the download button.
-
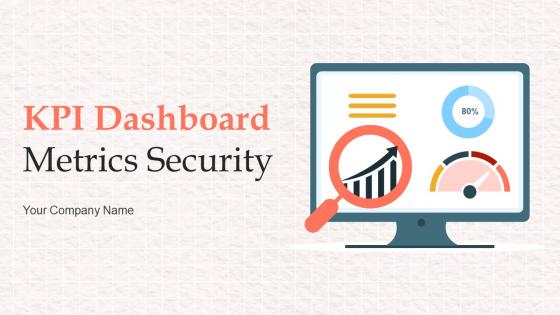 KPI Dashboard Metrics Security Powerpoint Ppt Template Bundles
Deliver a credible and compelling presentation by deploying this KPI Dashboard Metrics Security Powerpoint Ppt Template Bundles. Intensify your message with the right graphics, images, icons, etc. presented in this complete deck. This PPT template is a great starting point to convey your messages and build a good collaboration. The twelve slides added to this PowerPoint slideshow helps you present a thorough explanation of the topic. You can use it to study and present various kinds of information in the form of stats, figures, data charts, and many more. This KPI Dashboard Metrics Security Powerpoint Ppt Template Bundles PPT slideshow is available for use in standard and widescreen aspects ratios. So, you can use it as per your convenience. Apart from this, it can be downloaded in PNG, JPG, and PDF formats, all completely editable and modifiable. The most profound feature of this PPT design is that it is fully compatible with Google Slides making it suitable for every industry and business domain.
-
 KPI Dashboard Recruitment Powerpoint Ppt Template Bundles
Deliver a lucid presentation by utilizing this KPI Dashboard Recruitment Powerpoint Ppt Template Bundles. Use it to present an overview of the topic with the right visuals, themes, shapes, and graphics. This is an expertly designed complete deck that reinforces positive thoughts and actions. Use it to provide visual cues to your audience and help them make informed decisions. A wide variety of discussion topics can be covered with this creative bundle such as Human Resource Management Dashboard, Optimized Hiring Metrics, Average Working Hours KPI, Recruitment Conversion Rate KPI, Departmental Vacancies Metrics. All the twelve slides are available for immediate download and use. They can be edited and modified to add a personal touch to the presentation. This helps in creating a unique presentation every time. Not only that, with a host of editable features, this presentation can be used by any industry or business vertical depending on their needs and requirements. The compatibility with Google Slides is another feature to look out for in the PPT slideshow.
-
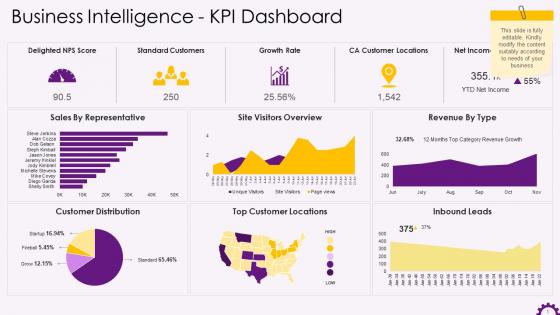 Business Intelligence KPI Dashboard Training Ppt
Presenting Business Intelligence KPI Dashboard. Our PowerPoint experts have included all the necessary templates, designs, icons, graphs, and other essential material. This deck is well crafted by extensive research. Slides consist of amazing visuals and appropriate content. These PPT slides can be instantly downloaded with just a click. Compatible with all screen types and monitors. Supports Google Slides. Premium Customer Support is available. Suitable for use by managers, employees, and organizations. These slides are easily customizable. You can edit the color, text, icon, and font size to suit your requirements.
-
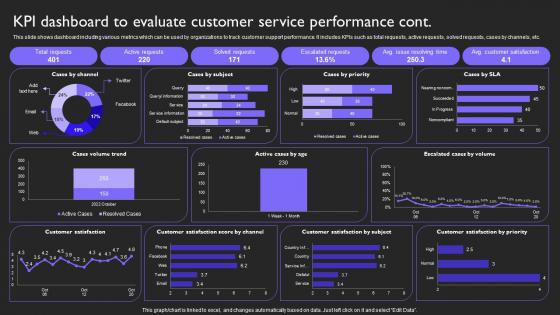 Kpi Dashboard To Evaluate Performance Cont Customer Service Provide Omnichannel Support Strategy SS V
This slide shows dashboard including various metrics which can be used by organizations to track customer support performance. It includes KPIs such as total requests, active requests, solved requests, cases by channels, etc. Deliver an outstanding presentation on the topic using this Kpi Dashboard To Evaluate Performance Cont Customer Service Provide Omnichannel Support Strategy SS V. Dispense information and present a thorough explanation of Service, Performance, Dashboard using the slides given. This template can be altered and personalized to fit your needs. It is also available for immediate download. So grab it now.
-
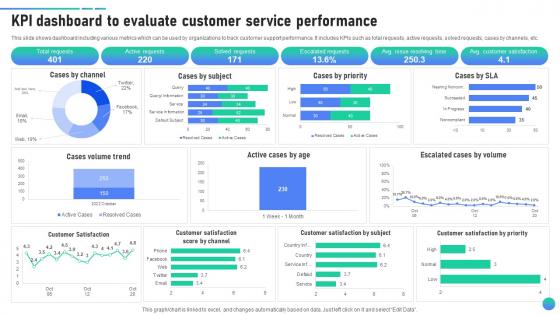 KPI Dashboard To Evaluate Customer Service Client Assistance Plan To Solve Issues Strategy SS V
This slide shows dashboard including various metrics which can be used by organizations to track customer support performance. It includes KPIs such as total requests, active requests, solved requests, cases by channels, etc. Present the topic in a bit more detail with this KPI Dashboard To Evaluate Customer Service Client Assistance Plan To Solve Issues Strategy SS V. Use it as a tool for discussion and navigation on Active Requests, Solved Requests. This template is free to edit as deemed fit for your organization. Therefore download it now.
-
 Human Resources KPI Dashboard Customer Engagement Department Statistics Employee Recruitment
Introduce your topic and host expert discussion sessions with this Human Resources KPI Dashboard Customer Engagement Department Statistics Employee Recruitment. This template is designed using high-quality visuals, images, graphics, etc, that can be used to showcase your expertise. Different topics can be tackled using the twelve slides included in this template. You can present each topic on a different slide to help your audience interpret the information more effectively. Apart from this, this PPT slideshow is available in two screen sizes, standard and widescreen making its delivery more impactful. This will not only help in presenting a birds-eye view of the topic but also keep your audience engaged. Since this PPT slideshow utilizes well-researched content, it induces strategic thinking and helps you convey your message in the best possible manner. The biggest feature of this design is that it comes with a host of editable features like color, font, background, etc. So, grab it now to deliver a unique presentation every time.
-
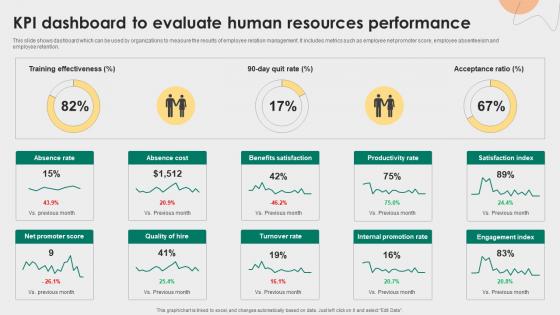 KPI Dashboard To Evaluate Human Resources Performance Employee Relations Management To Develop Positive
This slide shows dashboard which can be used by organizations to measure the results of employee relation management. It includes metrics such as employee net promoter score, employee absenteeism and employee retention. Deliver an outstanding presentation on the topic using this KPI Dashboard To Evaluate Human Resources Performance Employee Relations Management To Develop Positive. Dispense information and present a thorough explanation of Absence Rate, Benefits Satisfaction, Productivity Rate using the slides given. This template can be altered and personalized to fit your needs. It is also available for immediate download. So grab it now.
-
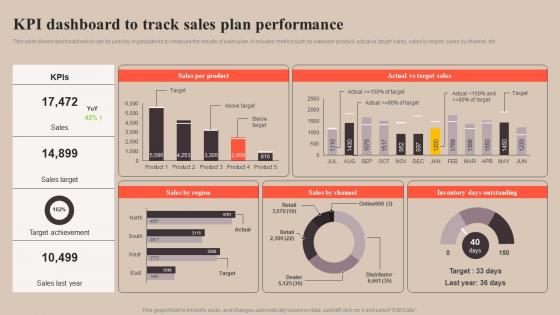 Kpi Dashboard To Track Sales Plan Strategy To Improve Enterprise Sales Performance MKT SS V
This slide shows dashboard which can be used by organizations to measure the results of sales plan. It includes metrics such as sales per product, actual vs target sales, sales by region, sales by channel, etc. Deliver an outstanding presentation on the topic using this Kpi Dashboard To Track Sales Plan Strategy To Improve Enterprise Sales Performance MKT SS V. Dispense information and present a thorough explanation of Performance, Dashboard, Sales Per Product using the slides given. This template can be altered and personalized to fit your needs. It is also available for immediate download. So grab it now.
-
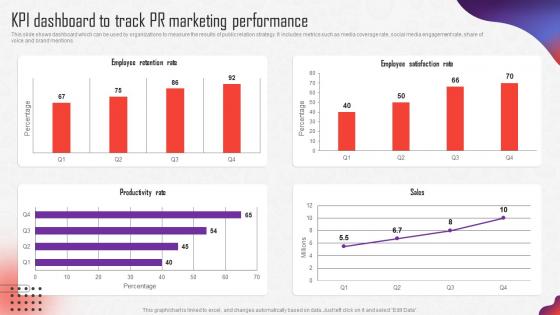 Internal Marketing Strategy KPI Dashboard To Track PR Marketing Performance MKT SS V
This slide shows dashboard which can be used by organizations to measure the results of public relation strategy. It includes metrics such as media coverage rate, social media engagement rate, share of voice and brand mentions. Deliver an outstanding presentation on the topic using this Internal Marketing Strategy KPI Dashboard To Track PR Marketing Performance MKT SS V. Dispense information and present a thorough explanation of Public Relation Strategy, Media Coverage Rate, Social Media Engagement Rate, Voice And Brand Mentions, KPI Dashboard using the slides given. This template can be altered and personalized to fit your needs. It is also available for immediate download. So grab it now.
-
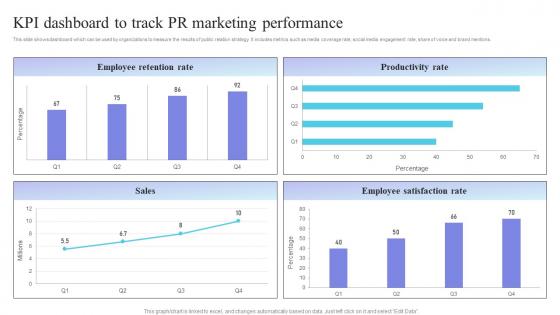 Internal Marketing Plan Kpi Dashboard To Track Pr Marketing Performance MKT SS V
This slide shows dashboard which can be used by organizations to measure the results of public relation strategy. It includes metrics such as media coverage rate, social media engagement rate, share of voice and brand mentions. Present the topic in a bit more detail with this Internal Marketing Plan Kpi Dashboard To Track Pr Marketing Performance MKT SS V. Use it as a tool for discussion and navigation on Employee Retention Rate, Productivity Rate. This template is free to edit as deemed fit for your organization. Therefore download it now.
-
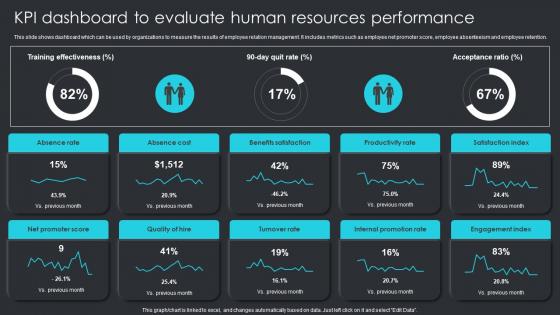 Kpi Dashboard To Evaluate Human Resources Performance Employee Engagement Plan To Increase Staff
This slide shows dashboard which can be used by organizations to measure the results of employee relation management. It includes metrics such as employee net promoter score, employee absenteeism and employee retention. Deliver an outstanding presentation on the topic using this KPI Dashboard To Evaluate Human Resources Performance Employee Engagement Plan To Increase Staff. Dispense information and present a thorough explanation of Absence Rate, Absence Cost, Productivity Rate using the slides given. This template can be altered and personalized to fit your needs. It is also available for immediate download. So grab it now.
-
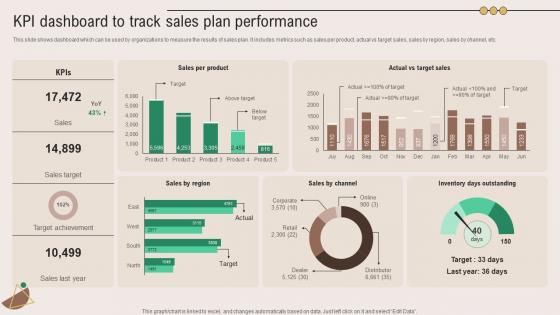 Kpi Dashboard To Track Plan Performance Marketing Plan To Grow Product Strategy SS V
This slide shows dashboard which can be used by organizations to measure the results of sales plan. It includes metrics such as sales per product, actual vs target sales, sales by region, sales by channel, etc. Present the topic in a bit more detail with this Kpi Dashboard To Track Plan Performance Marketing Plan To Grow Product Strategy SS V. Use it as a tool for discussion and navigation on Sales Per Product, Actual Vs Target Sales. This template is free to edit as deemed fit for your organization. Therefore download it now.
-
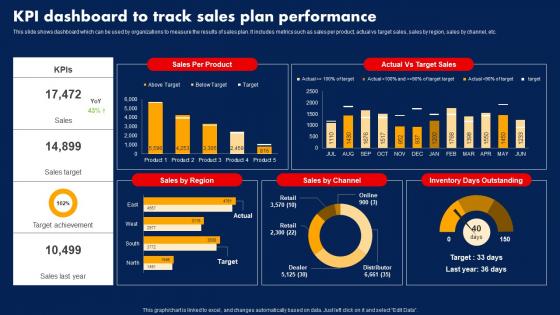 Sales Strategy To Boost Kpi Dashboard To Track Sales Plan Performance Strategy SS V
This slide shows dashboard which can be used by organizations to measure the results of sales plan. It includes metrics such as sales per product, actual vs target sales, sales by region, sales by channel, etc. Present the topic in a bit more detail with this Sales Strategy To Boost Kpi Dashboard To Track Sales Plan Performance Strategy SS V. Use it as a tool for discussion and navigation on KPI Dashboard To Track, Sales Plan Performance, Actual Vs Target Sales, Sales By Region, Sales By Channel. This template is free to edit as deemed fit for your organization. Therefore download it now.
-
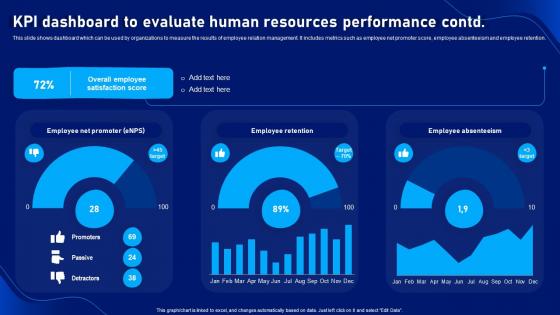 Strategic Plan To Develop KPI Dashboard To Evaluate Human Resources Performance
This slide shows dashboard which can be used by organizations to measure the results of employee relation management. It includes metrics such as employee net promoter score, employee absenteeism and employee retention. Present the topic in a bit more detail with this Strategic Plan To Develop KPI Dashboard To Evaluate Human Resources Performance. Use it as a tool for discussion and navigation on KPI Dashboard, Human Resources Performance, Employee Retention, Promoter Score. This template is free to edit as deemed fit for your organization. Therefore download it now.
-
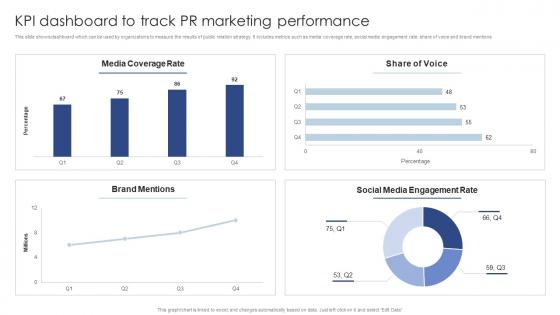 KPI Dashboard To Track Pr Marketing Performance Public Relations Marketing To Develop MKT SS V
This slide shows dashboard which can be used by organizations to measure the results of public relation strategy. It includes metrics such as media coverage rate, social media engagement rate, share of voice and brand mentions. Deliver an outstanding presentation on the topic using this KPI Dashboard To Track Pr Marketing Performance Public Relations Marketing To Develop MKT SS V. Dispense information and present a thorough explanation of Kpi Dashboard To Track, Marketing Performance using the slides given. This template can be altered and personalized to fit your needs. It is also available for immediate download. So grab it now.
-
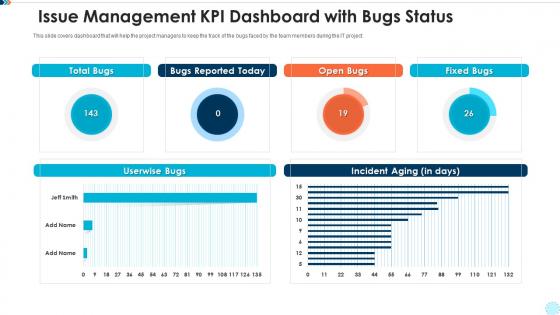 Issue management kpi dashboard with bugs status
Presenting our well structured Issue Management KPI Dashboard With Bugs Status. The topics discussed in this slide are Issue Management Dashboard For Multiple Projects. This is an instantly available PowerPoint presentation that can be edited conveniently. Download it right away and captivate your audience.
-
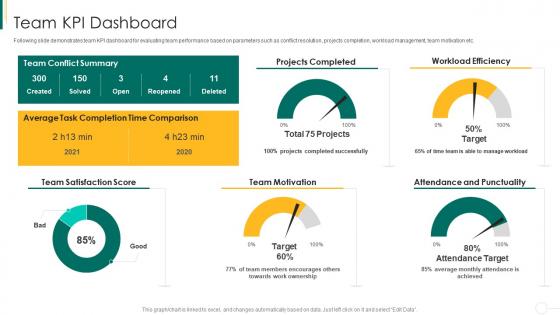 Team kpi dashboard action plan for enhancing team capabilities
Following slide demonstrates team KPI dashboard for evaluating team performance based on parameters such as conflict resolution, projects completion, workload management, team motivation etc. Deliver an outstanding presentation on the topic using this Team Kpi Dashboard Action Plan For Enhancing Team Capabilities. Dispense information and present a thorough explanation of Team Kpi Dashboard using the slides given. This template can be altered and personalized to fit your needs. It is also available for immediate download. So grab it now.
-
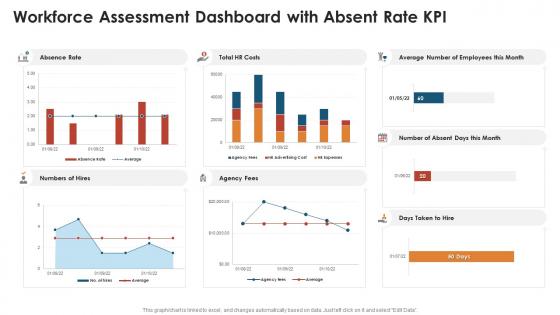 Workforce assessment dashboard with absent rate kpi
Introducing our workforce assessment dashboard with absent rate KPI set of slides. The topics discussed in these slides are Costs, Average. This is an immediately available PowerPoint presentation that can be conveniently customized. Download it and convince your audience.
-
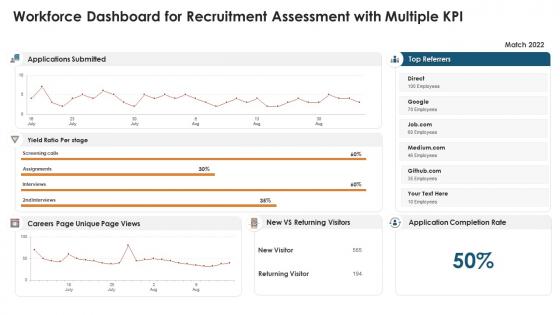 Workforce dashboard for recruitment assessment with multiple kpi
Introducing our Workforce Dashboard For Recruitment Assessment With Multiple KPI set of slides. The topics discussed in these slides are Workforce Dashboard For Recruitment Assessment With Multiple KPI. This is an immediately available PowerPoint presentation that can be conveniently customized. Download it and convince your audience.
-
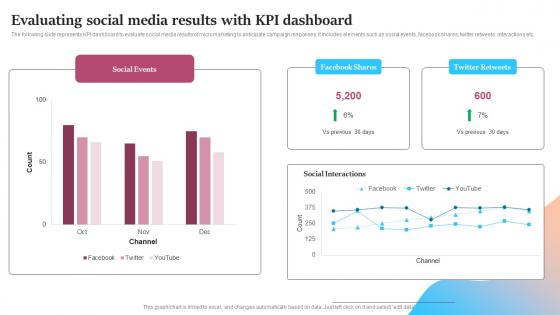 Evaluating Social Media Results With KPI Dashboard Micromarketing Adoption Guide MKT SS V
The following slide represents KPI dashboard to evaluate social media results of micromarketing to anticipate campaign responses. It includes elements such as social events, facebook shares, twitter retweets, interactions etc. Present the topic in a bit more detail with this Evaluating Social Media Results With KPI Dashboard Micromarketing Adoption Guide MKT SS V. Use it as a tool for discussion and navigation on Social, Results, Events. This template is free to edit as deemed fit for your organization. Therefore download it now.
-
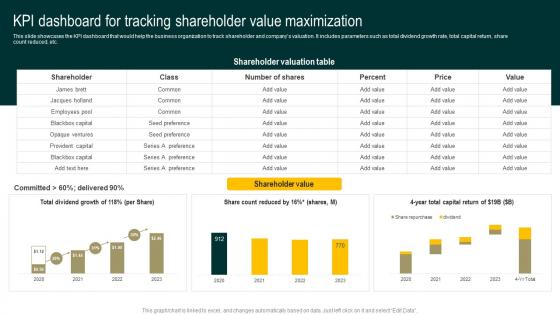 KPI Dashboard For Tracking Shareholder Value Streamlined Holistic Marketing Techniques MKT SS V
This slide showcases the KPI dashboard that would help the business organization to track shareholder and companys valuation. It includes parameters such as total dividend growth rate, total capital return, share count reduced, etc. Present the topic in a bit more detail with this KPI Dashboard For Tracking Shareholder Value Streamlined Holistic Marketing Techniques MKT SS V. Use it as a tool for discussion and navigation on Growth Reduced, Capital. This template is free to edit as deemed fit for your organization. Therefore download it now.
-
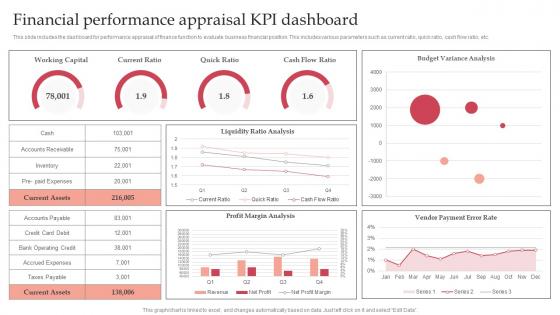 Financial Performance Appraisal KPI Dashboard
This slide includes the dashboard for performance appraisal of finance function to evaluate business financial position. This includes various parameters such as current ratio, quick ratio, cash flow ratio, etc. Presenting our well structured Financial Performance Appraisal KPI Dashboard. The topics discussed in this slide are Financial, Performance, Appraisal. This is an instantly available PowerPoint presentation that can be edited conveniently. Download it right away and captivate your audience.
-
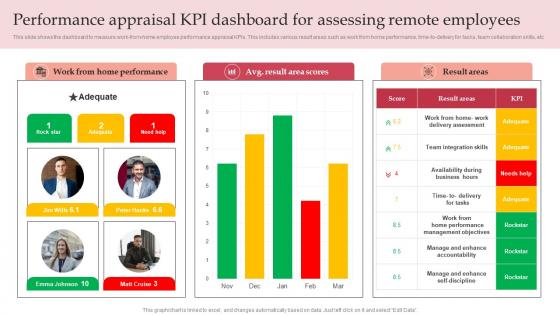 Performance Appraisal KPI Dashboard For Assessing Remote Employees
This slide shows the dashboard to measure work from home employee performance appraisal KPIs. This includes various result areas such as work from home performance, time to delivery for tasks, team collaboration skills, etc Introducing our Performance Appraisal KPI Dashboard For Assessing Remote Employees set of slides. The topics discussed in these slides are Performance, Employees, Remote. This is an immediately available PowerPoint presentation that can be conveniently customized. Download it and convince your audience.
-
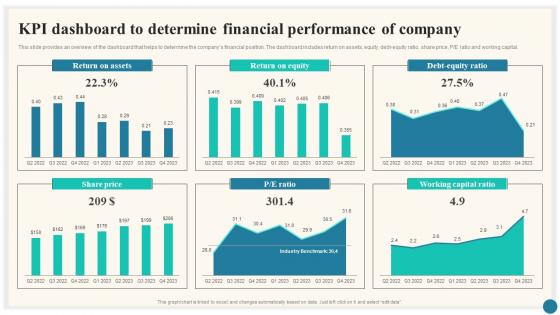 Kpi Dashboard Performance Of Company Trade Marketing Plan To Increase Market Share Strategy SS
This slide provides an overview of the dashboard that helps to determine the companys financial position. The dashboard includes return on assets, equity, debt-equity ratio, share price, P or E ratio and working capital. Present the topic in a bit more detail with this Kpi Dashboard Performance Of Company Trade Marketing Plan To Increase Market Share Strategy SS. Use it as a tool for discussion and navigation on Dashboard, Financial, Performance. This template is free to edit as deemed fit for your organization. Therefore download it now.
-
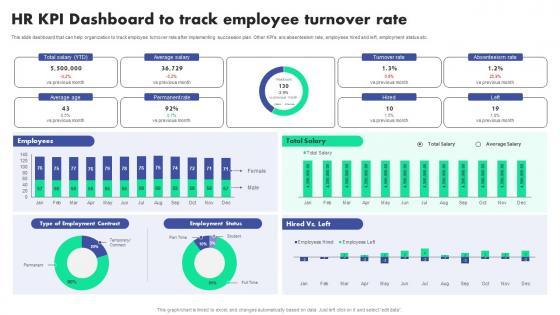 Hr Kpi Dashboard To Track Employee Succession Planning To Identify Talent And Critical Job Roles
This slide dashboard that can help organization to track employee turnover rate after implementing succession plan. Other KPIs are absenteeism rate, employees hired and left, employment status etc. Present the topic in a bit more detail with this Hr Kpi Dashboard To Track Employee Succession Planning To Identify Talent And Critical Job Roles. Use it as a tool for discussion and navigation on Dashboard, Organization, Implementing Succession. This template is free to edit as deemed fit for your organization. Therefore download it now.
-
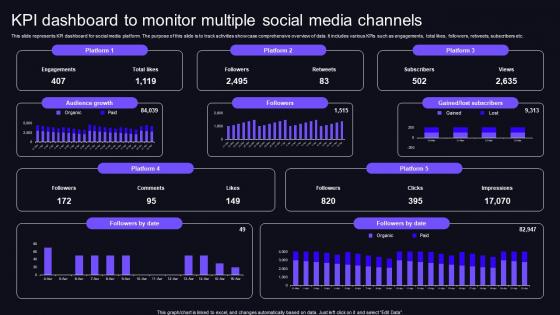 KPI Dashboard To Monitor Multiple Social Media Channels
This slide represents KPI dashboard for social media platform. The purpose of this slide is to track activities showcase comprehensive overview of data. It includes various KPIs such as engagements, total likes, followers, retweets, subscribers etc. Presenting our well structured KPI Dashboard To Monitor Multiple Social Media Channels. The topics discussed in this slide are Growth, Social, Channels. This is an instantly available PowerPoint presentation that can be edited conveniently. Download it right away and captivate your audience.
-
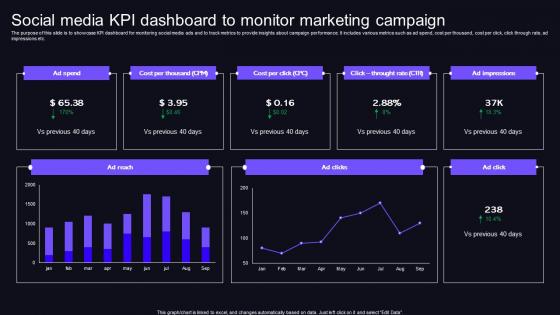 Social Media KPI Dashboard To Monitor Marketing Campaign
The purpose of this slide is to showcase KPI dashboard for monitoring social media ads and to track metrics to provide insights about campaign performance. It includes various metrics such as ad spend, cost per thousand, cost per click, click through rate, ad impressions etc. Introducing our Social Media KPI Dashboard To Monitor Marketing Campaign set of slides. The topics discussed in these slides are Monitor, Marketing, Campaign. This is an immediately available PowerPoint presentation that can be conveniently customized. Download it and convince your audience.
-
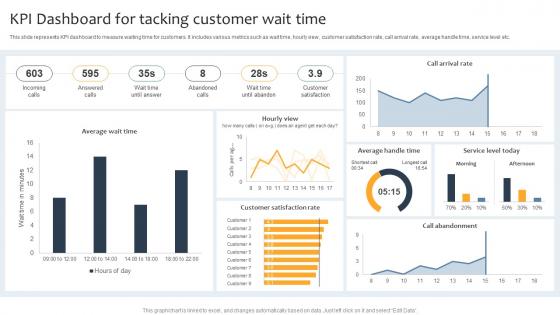 Kpi Dashboard For Tacking Customer Wait Time
This slide represents KPI dashboard to measure waiting time for customers. It includes various metrics such as wait time, hourly view, customer satisfaction rate, call arrival rate, average handle time, service level etc. Introducing our Kpi Dashboard For Tacking Customer Wait Time set of slides. The topics discussed in these slides are Average Handle Time, Call Arrival Rate, Service Level Today. This is an immediately available PowerPoint presentation that can be conveniently customized. Download it and convince your audience.
-
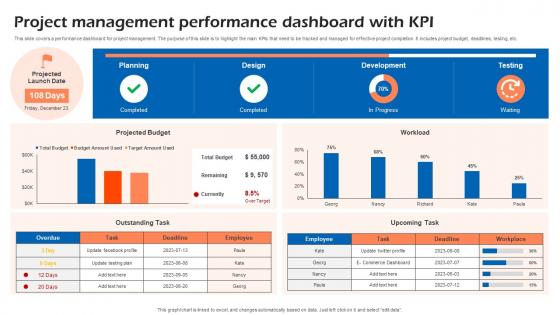 Project Management Performance Dashboard With KPI
This slide covers a performance dashboard for project management. The purpose of this slide is to highlight the main KPIs that need to be tracked and managed for effective project completion. It includes project budget, deadlines, testing, etc.Introducing our Project Management Performance Dashboard With KPI set of slides. The topics discussed in these slides are E Commerce Dashboard, Outstanding Task, Projected Budget. This is an immediately available PowerPoint presentation that can be conveniently customized. Download it and convince your audience.
-
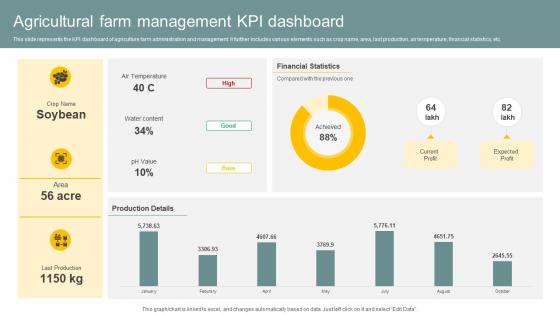 Agricultural Farm Management KPI Dashboard
This slide represents the KPI dashboard of agriculture farm administration and management. It further includes various elements such as crop name, area, last production, air temperature, financial statistics, etc.Presenting our well structured Agricultural Farm Management KPI Dashboard. The topics discussed in this slide are Agricultural, Management KPI Dashboard. This is an instantly available PowerPoint presentation that can be edited conveniently. Download it right away and captivate your audience.
-
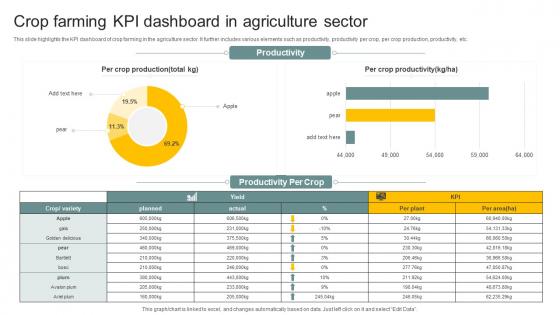 Crop Farming KPI Dashboard In Agriculture Sector
This slide highlights the KPI dashboard of crop farming in the agriculture sector. It further includes various elements such as productivity, productivity per crop, per crop production, productivity, etc.Presenting our well structured Crop Farming KPI Dashboard In Agriculture Sector. The topics discussed in this slide are Productivity, Golden Delicious, Agriculture Sector. This is an instantly available PowerPoint presentation that can be edited conveniently. Download it right away and captivate your audience.
-
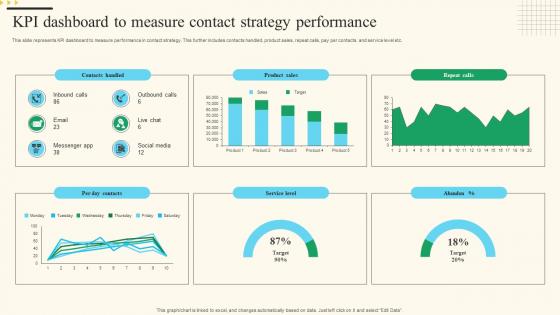 Kpi Dashboard To Measure Contact Strategy Performance
This slide represents KPI dashboard to measure performance in contact strategy. This further includes contacts handled, product sales, repeat calls, pay per contacts and service level etc. Introducing our Kpi Dashboard To Measure Contact Strategy Performance set of slides. The topics discussed in these slides are Contacts Handled, Product Sales. This is an immediately available PowerPoint presentation that can be conveniently customized. Download it and convince your audience.
-
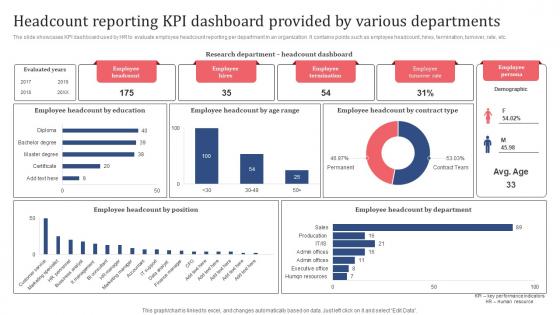 Headcount Reporting KPI Dashboard Provided By Various Departments
The slide showcases KPI dashboard used by HR to evaluate employee headcount reporting per department in an organization. It contains points such as employee headcount, hires, termination, turnover, rate, etc. Introducing our Headcount Reporting KPI Dashboard Provided By Various Departments set of slides. The topics discussed in these slides are Employee Headcount, Employee Termination, Employee Persona. This is an immediately available PowerPoint presentation that can be conveniently customized. Download it and convince your audience.
-
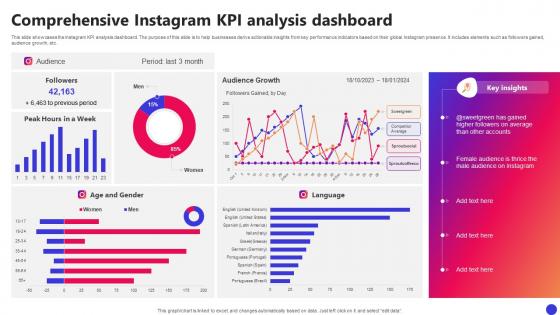 Comprehensive Instagram KPI Analysis Dashboard
This slide showcases the Instagram KPI analysis dashboard. The purpose of this slide is to help businesses derive actionable insights from key performance indicators based on their global Instagram presence. It includes elements such as followers gained, audience growth, etc.Introducing our Comprehensive Instagram KPI Analysis Dashboard set of slides. The topics discussed in these slides are Audience Growth, Female Audience, Comprehensive Instagram. This is an immediately available PowerPoint presentation that can be conveniently customized. Download it and convince your audience.
-
 Data Driven Instagram KPI Dashboard
This slide showcases the Instagram KPI dashboard. The purpose of this slide is to provide businesses and influencers with a visually informative tool to monitor and analyze key performance indicators related to their Instagram presence. It includes elements such as profile visits, impressions, etc.Presenting our well structured Data Driven Instagram KPI Dashboard. The topics discussed in this slide are Data Driven, Instagram Kpi Dashboard, Track Leads. This is an instantly available PowerPoint presentation that can be edited conveniently. Download it right away and captivate your audience.
-
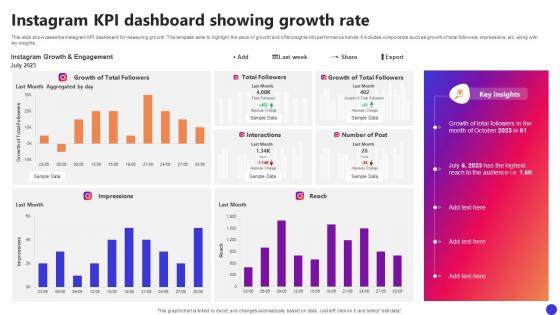 Instagram KPI Dashboard Showing Growth Rate
This slide showcases the Instagram KPI dashboard for measuring growth. This template aims to highlight the pace of growth and offer insights into performance trends. It includes components such as growth of total followers, impressions, etc. along with ley insights.Introducing our Instagram KPI Dashboard Showing Growth Rate set of slides. The topics discussed in these slides are Instagram Kpi Dashboard, Showing Growth Rate. This is an immediately available PowerPoint presentation that can be conveniently customized. Download it and convince your audience.
-
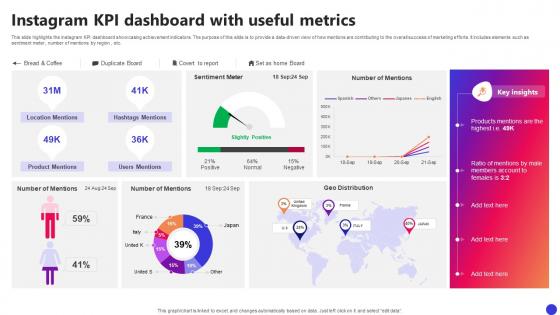 Instagram KPI Dashboard With Useful Metrics
This slide highlights the Instagram KPI dashboard showcasing achievement indicators. The purpose of this slide is to provide a data driven view of how mentions are contributing to the overall success of marketing efforts. It includes elements such as sentiment meter, number of mentions by region , etc.Presenting our well structured Instagram KPI Dashboard With Useful Metrics. The topics discussed in this slide are Location Mentions, Product Mentions, Products Mentions. This is an instantly available PowerPoint presentation that can be edited conveniently. Download it right away and captivate your audience.
-
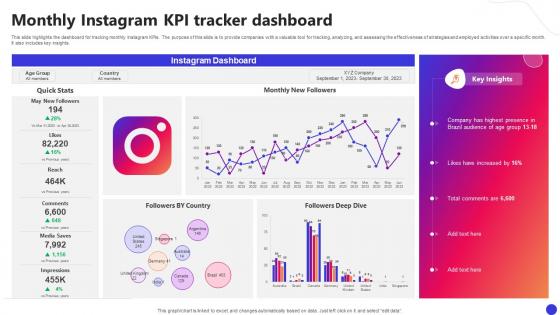 Monthly Instagram KPI Tracker Dashboard
This slide highlights the dashboard for tracking monthly Instagram KPIs. The purpose of this slide is to provide companies with a valuable tool for tracking, analyzing, and assessing the effectiveness of strategies and employed activities over a specific month. It also includes key insights.Presenting our well structured Monthly Instagram KPI Tracker Dashboard. The topics discussed in this slide are Total Comments, Instagram Dashboard, Monthly Instagram. This is an instantly available PowerPoint presentation that can be edited conveniently. Download it right away and captivate your audience.
-
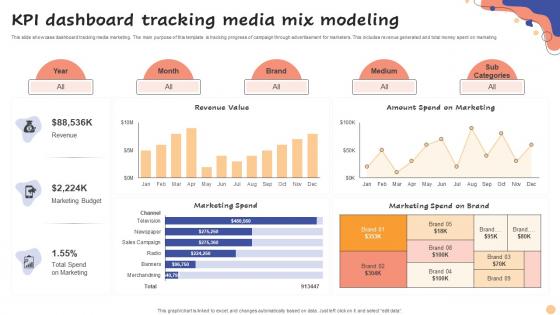 KPI Dashboard Tracking Media Mix Modeling
This slide showcase dashboard tracking media marketing. The main purpose of this template is tracking progress of campaign through advertisement for marketers. This includes revenue generated and total money spent on marketing.Introducing our KPI Dashboard Tracking Media Mix Modeling set of slides. The topics discussed in these slides are Revenue Value, Marketing Spend, Marketing Spend This is an immediately available PowerPoint presentation that can be conveniently customized. Download it and convince your audience.
-
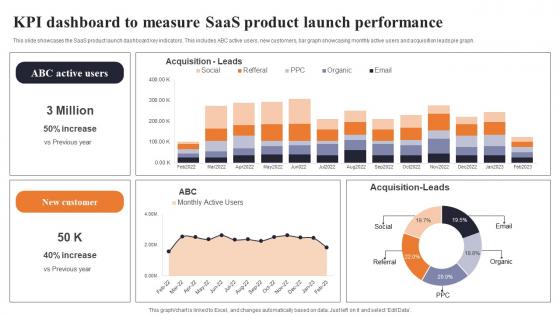 KPI Dashboard To Measure Saas Product Launch Performance
This slide showcases the SaaS product launch dashboard key indicators. This includes ABC active users, new customers, bar graph showcasing monthly active users and acquisition leads pie graph. Introducing our KPI Dashboard To Measure Saas Product Launch Performance set of slides. The topics discussed in these slides are Product Launch, Performance. This is an immediately available PowerPoint presentation that can be conveniently customized. Download it and convince your audience.
-
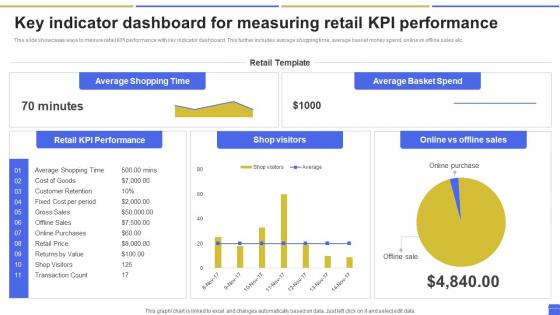 Key Indicator Dashboard For Measuring Retail KPI Performance
This slide showcases ways to mesure retail KPI performance with key indicator dashboard. This further includes average shopping time, average basket money spend, online vs offline sales etc. Introducing our Key Indicator Dashboard For Measuring Retail KPI Performance set of slides. The topics discussed in these slides are Average Shopping Time, Average Basket Spend. This is an immediately available PowerPoint presentation that can be conveniently customized. Download it and convince your audience.
-
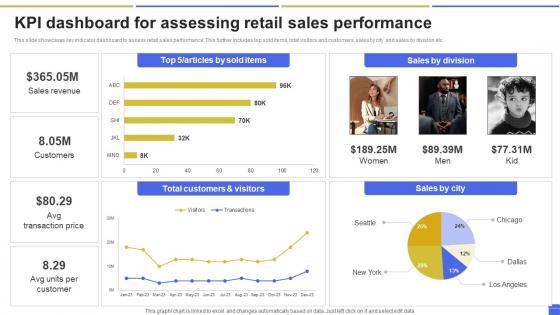 KPI Dashboard For Assessing Retail Sales Performance
This slide showcases key indicator dashboard to assess retail sales performance. This further includes top sold items, total visitors and customers, sales by city and sales by division etc. Presenting our well structured KPI Dashboard For Assessing Retail Sales Performance. The topics discussed in this slide are Sales By Division, Transaction Price.This is an instantly available PowerPoint presentation that can be edited conveniently. Download it right away and captivate your audience.
-
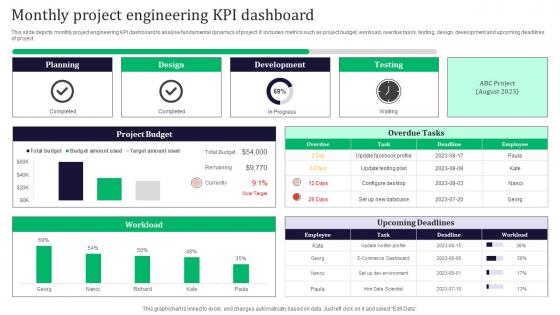 Monthly Project Engineering KPI Dashboard
This slide depicts monthly project engineering KPI dashboard to analyse fundamental dynamics of project. It includes metrics such as project budget, workload, overdue tasks, testing, design, development and upcoming deadlines of project. Introducing our Monthly Project Engineering KPI Dashboard set of slides. The topics discussed in these slides are Planning, Development. This is an immediately available PowerPoint presentation that can be conveniently customized. Download it and convince your audience.
-
 Rental Property Leasing Kpi Dashboard
This slide depicts dashboard of key performance indicator of rental property to analyse leasing performance. It includes KPIs such as registered users, property status, within month let properties, property views, termination status and average letting time of properties Presenting our well structured Rental Property Leasing Kpi Dashboard. The topics discussed in this slide are Property Status, Average Letting Time.This is an instantly available PowerPoint presentation that can be edited conveniently. Download it right away and captivate your audience.
-
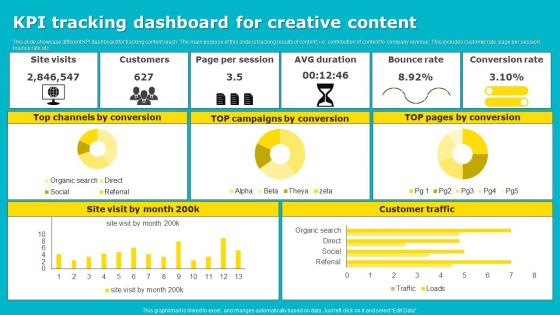 KPI Tracking Dashboard For Creative Content
This slide showcase different KPI dashboard for tracking content reach. The main purpose of this slide is tracking results of content, i.e. contribution of content to company revenue. This includes customer rate, page per session, bounce rate,etc. Introducing our KPI Tracking Dashboard For Creative Content set of slides. The topics discussed in these slides are Top Channels By Conversion, Customer Traffic. This is an immediately available PowerPoint presentation that can be conveniently customized. Download it and convince your audience.
-
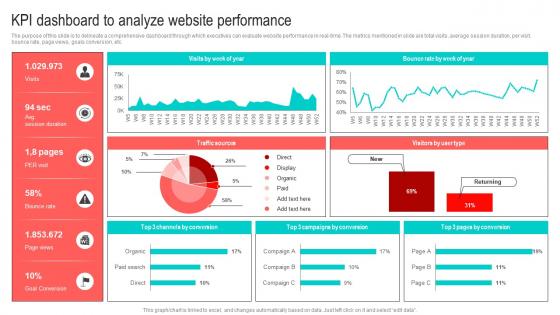 KPI Dashboard To Analyze Website Best Marketing Strategies For Your D2C Brand MKT SS V
The purpose of this slide is to delineate a comprehensive dashboard through which executives can evaluate website performance in real-time. The metrics mentioned in slide are total visits, average session duration, per visit, bounce rate, page views, goals conversion, etc. Present the topic in a bit more detail with this KPI Dashboard To Analyze Website Best Marketing Strategies For Your D2C Brand MKT SS V. Use it as a tool for discussion and navigation on Analyze, Website, Performance. This template is free to edit as deemed fit for your organization. Therefore download it now.
-
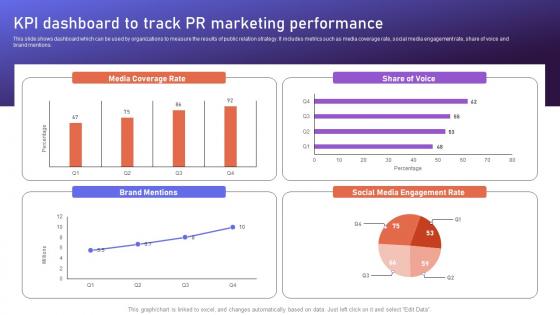 KPI Dashboard To Track PR Marketing Brand Positioning Strategies To Boost Online MKT SS V
This slide shows dashboard which can be used by organizations to measure the results of public relation strategy. It includes metrics such as media coverage rate, social media engagement rate, share of voice and brand mentions. Present the topic in a bit more detail with this KPI Dashboard To Track PR Marketing Brand Positioning Strategies To Boost Online MKT SS V. Use it as a tool for discussion and navigation on Marketing, Performance, Coverage. This template is free to edit as deemed fit for your organization. Therefore download it now.
-
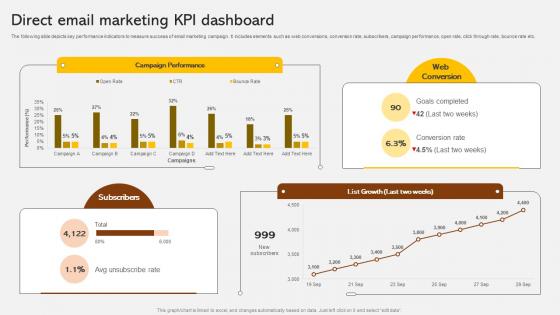 Direct Email Marketing KPI Dashboard Adopting Integrated Marketing Communication MKT SS V
The following slide depicts key performance indicators to measure success of email marketing campaign. It includes elements such as web conversions, conversion rate, subscribers, campaign performance, open rate, click through rate, bounce rate etc. Present the topic in a bit more detail with this Direct Email Marketing KPI Dashboard Adopting Integrated Marketing Communication MKT SS V. Use it as a tool for discussion and navigation on Email, Marketing, Performance. This template is free to edit as deemed fit for your organization. Therefore download it now.


