Supply Chain Kpi Dashboard Powerpoint Presentation Slides
Introducing our supply chain KPI dashboard PowerPoint presentation slides. Discuss your supply chain processes with the help of this order processing PowerPoint deck. This inventory onboarding PPT theme introduces a slide that discusses the order processing time of the company. This ready-made supply chain PowerPoint design helps in the discussion of the contributors and distributors of the inventory of the company. This warehouse management PPT layout contains a slide which elaborates on the monitoring of the performance of the customer service. Incorporating this supply order dashboard PPT theme allows you to forecast the budget for supply chain management. This inventory dashboard PowerPoint creative set contains a slide which showcases the master production planning layout. Choose this warehouse organization PowerPoint design to reflect organization and assurance. This supply order PPT deck lets you make required variations to icons and colors. Download our supply chain kpi PPT slide if you want to understand the meaning of true perfection.
Introducing our supply chain KPI dashboard PowerPoint presentation slides. Discuss your supply chain processes with the hel..
- Google Slides is a new FREE Presentation software from Google.
- All our content is 100% compatible with Google Slides.
- Just download our designs, and upload them to Google Slides and they will work automatically.
- Amaze your audience with SlideTeam and Google Slides.
-
Want Changes to This PPT Slide? Check out our Presentation Design Services
- WideScreen Aspect ratio is becoming a very popular format. When you download this product, the downloaded ZIP will contain this product in both standard and widescreen format.
-

- Some older products that we have may only be in standard format, but they can easily be converted to widescreen.
- To do this, please open the SlideTeam product in Powerpoint, and go to
- Design ( On the top bar) -> Page Setup -> and select "On-screen Show (16:9)” in the drop down for "Slides Sized for".
- The slide or theme will change to widescreen, and all graphics will adjust automatically. You can similarly convert our content to any other desired screen aspect ratio.
Compatible With Google Slides

Get This In WideScreen
You must be logged in to download this presentation.
PowerPoint presentation slides
Presenting our supply chain KPI dashboard PowerPoint presentation slides. This PowerPoint design contains fifty-nine slides in it which can be completely customized and edited. It is available for both standard as well as for widescreen formats. This PowerPoint template is compatible with all the presentation software like Microsoft Office, Google Slides, etc. You can download this PPT layout from below.
People who downloaded this PowerPoint presentation also viewed the following :
Content of this Powerpoint Presentation
Slide 1: This slide introduces Supply Chain KPI Dashboard. State Your Company Name and get started.
Slide 2: This is an Agenda slide. State your presentation agendas here.
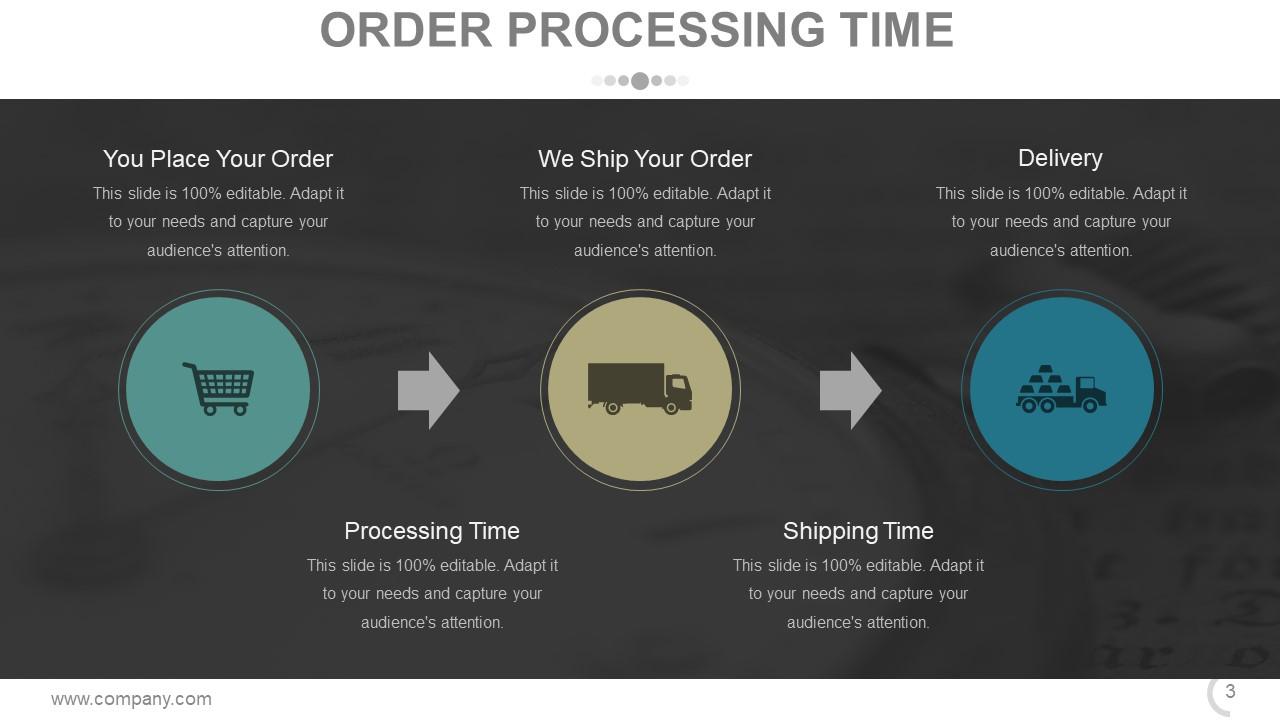
Slide 3: This slide shows Processing Time displaying- Shipping Time, Delivery, You Place Your Order, We Ship Your Order.
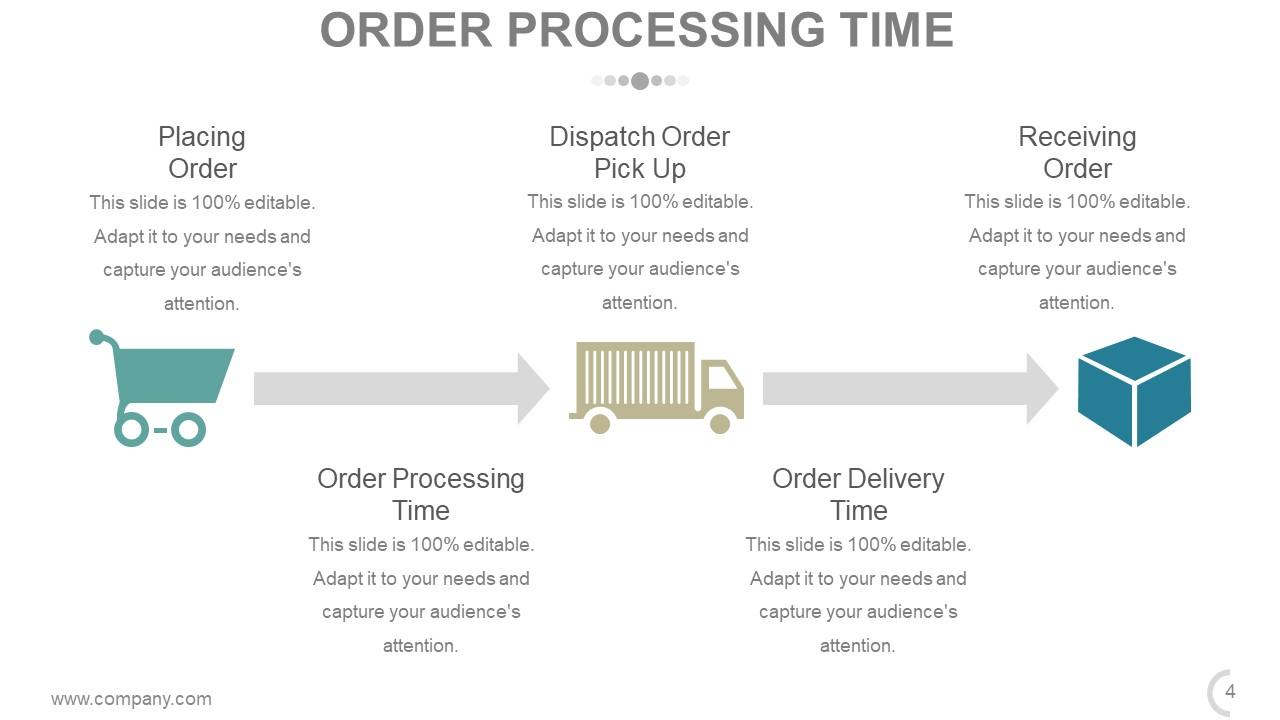
Slide 4: This slide showcases Order Processing Time with- Placing Order, Dispatch Order Pick Up, Receiving Order, Order Processing Time, Order Delivery Time.
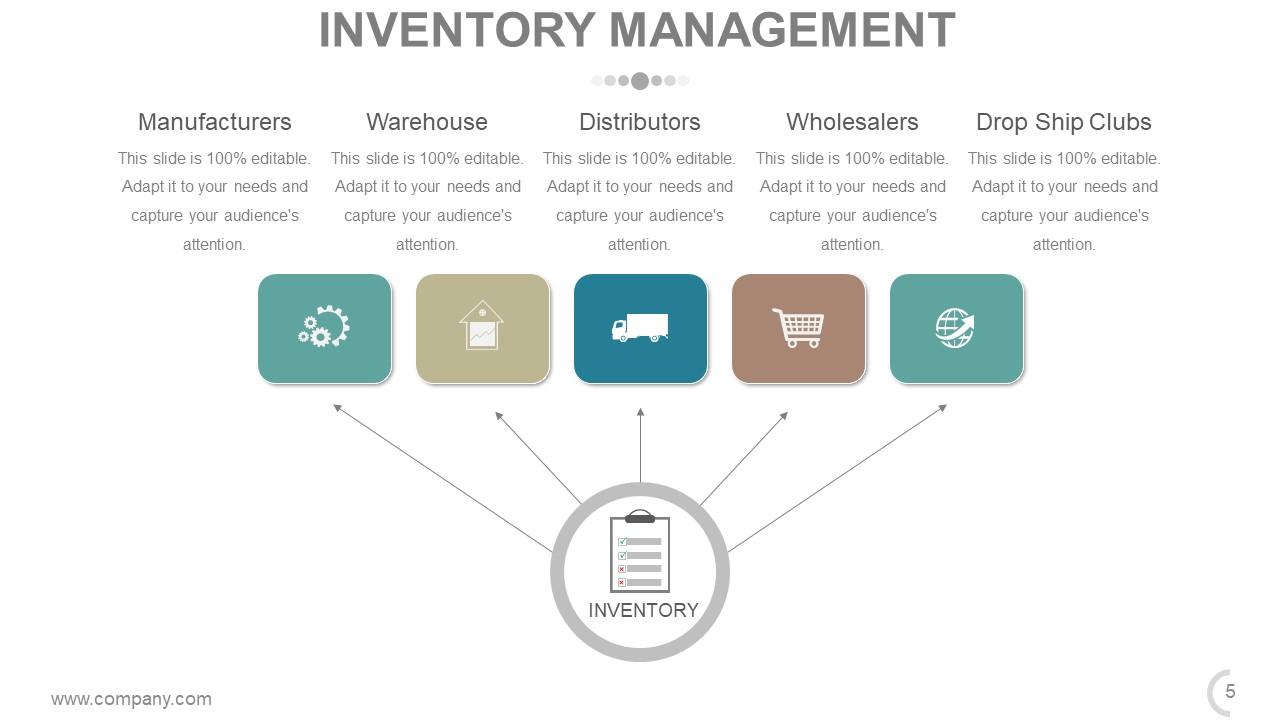
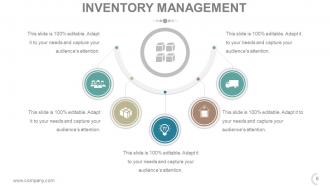
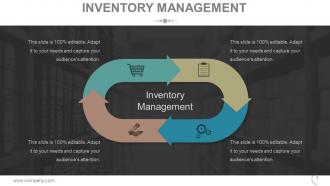
Slide 5: This slide showcases Inventory Management showing- Manufacturers, Warehouse, Distributors, Wholesalers, Drop Ship Clubs.
Slide 6: This slide presents Inventory Management with icon imagery.
Slide 7: This slide also presents Inventory Management with icon imagery.
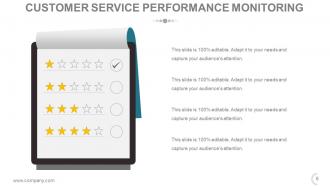
Slide 8: This slide shows Customer Service Performance Monitoring with a creative starboard imagery.
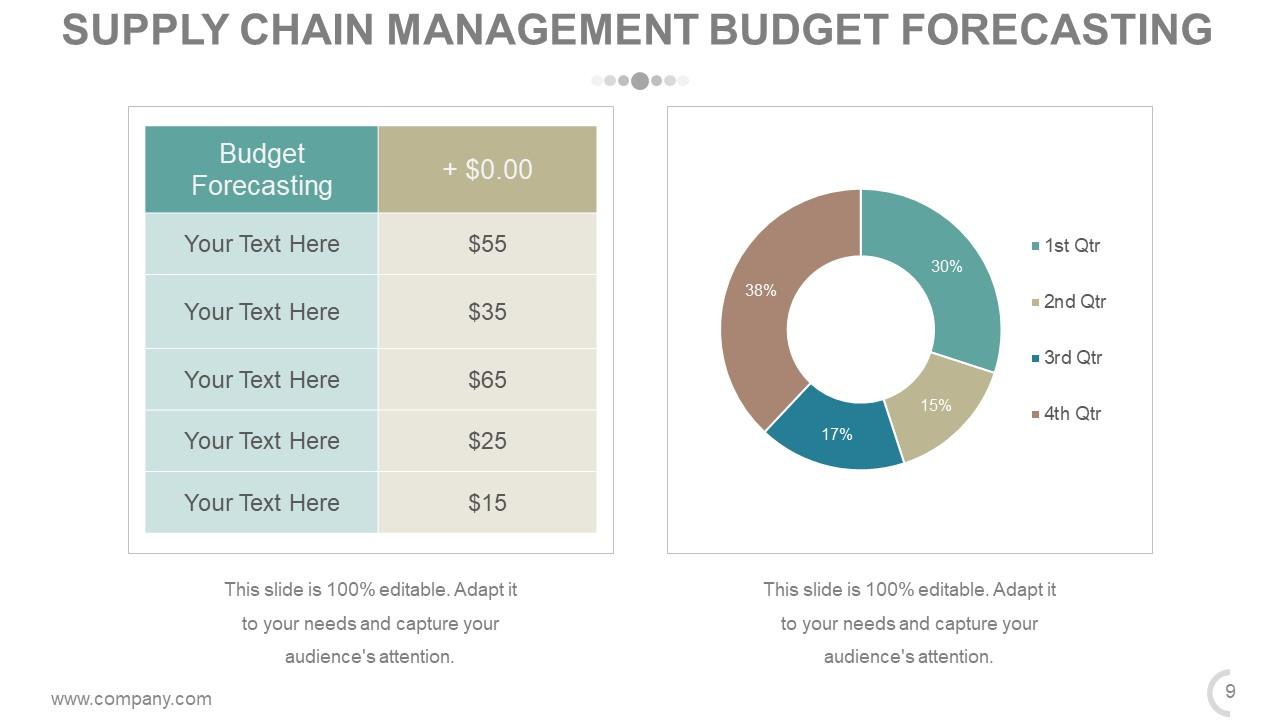
Slide 9: This slide displays Supply Chain Management Budget Forecasting in table and chart form.
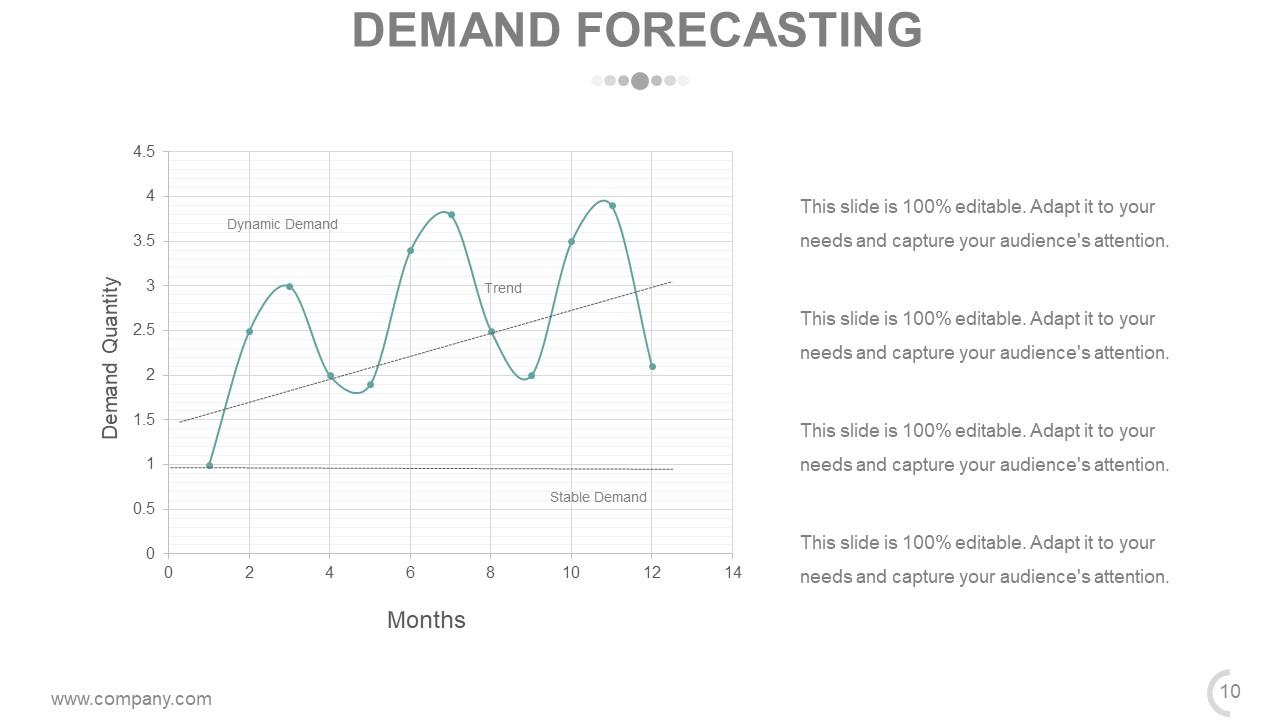
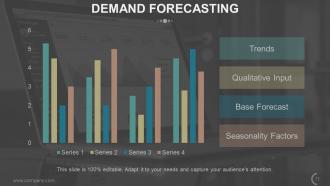
Slide 10: This slide showcases Demand Forecasting graph showing- Dynamic Demand Stable Demand Trend in terms of Demand Quantity and Months
Slide 11: This slide presents Demand Forecasting with- Trends, Qualitative Input, Seasonality Factors, Base Forecast.
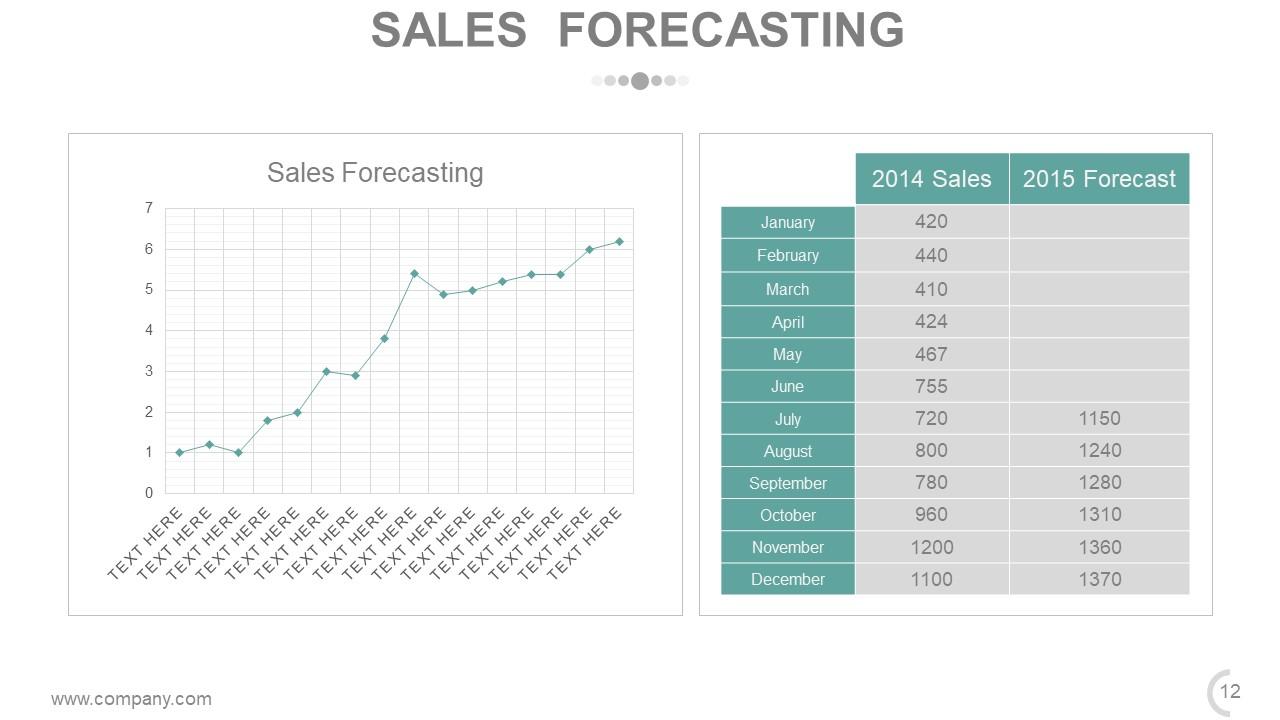
Slide 12: This is a Sales Forecasting graph slide.
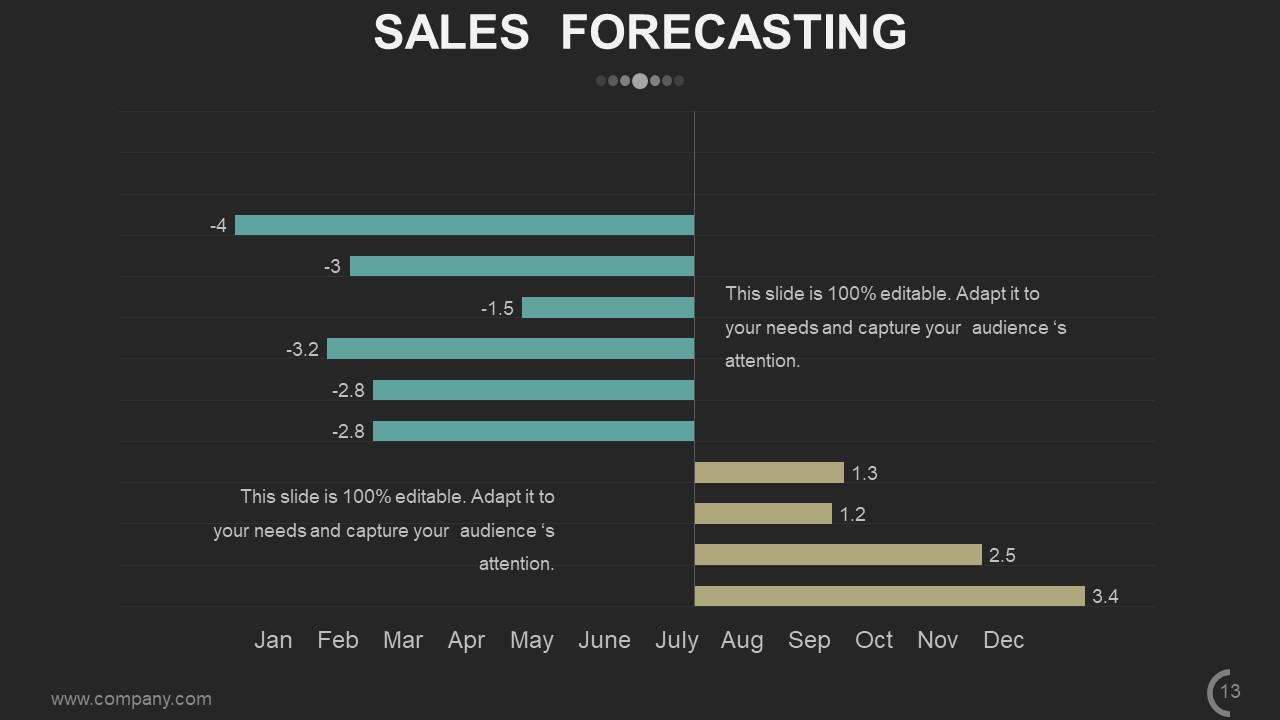
Slide 13: This is a Sales Forecasting bar graph slide.
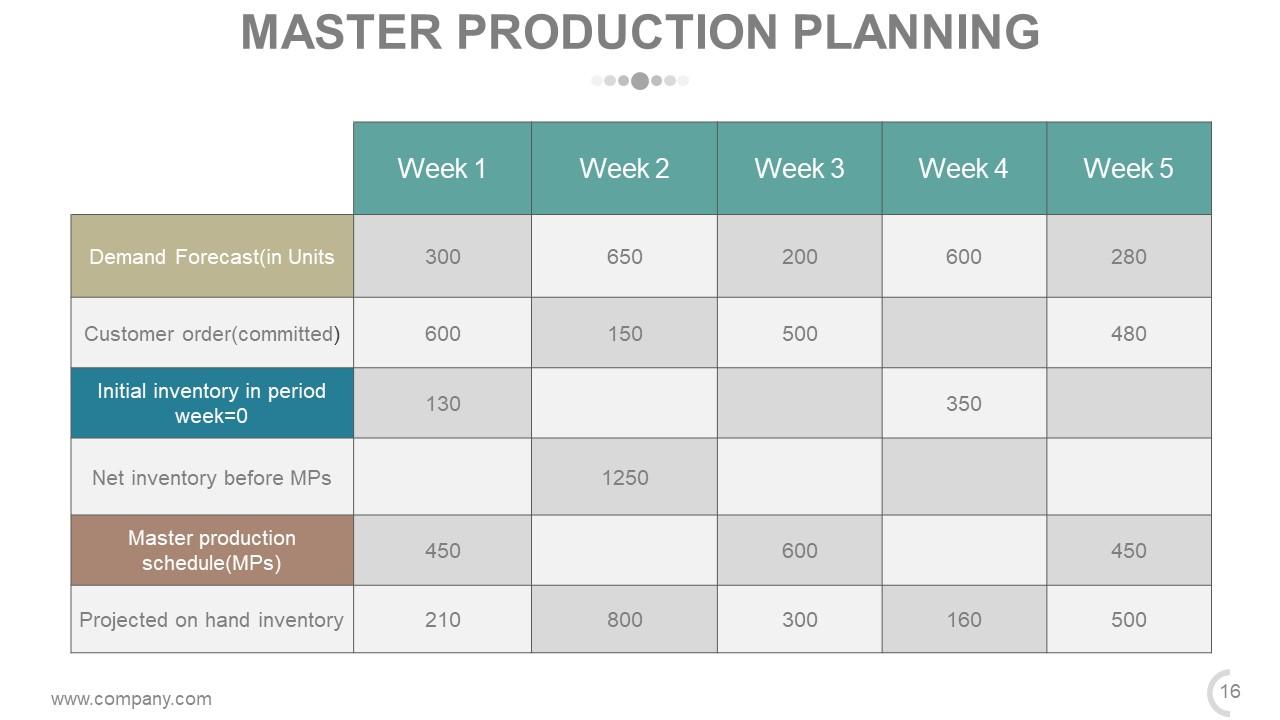
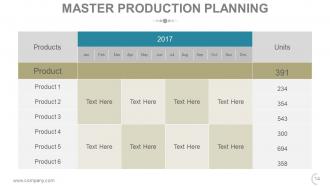
Slide 14: This slide showcases Master Production Planning in tabular form.
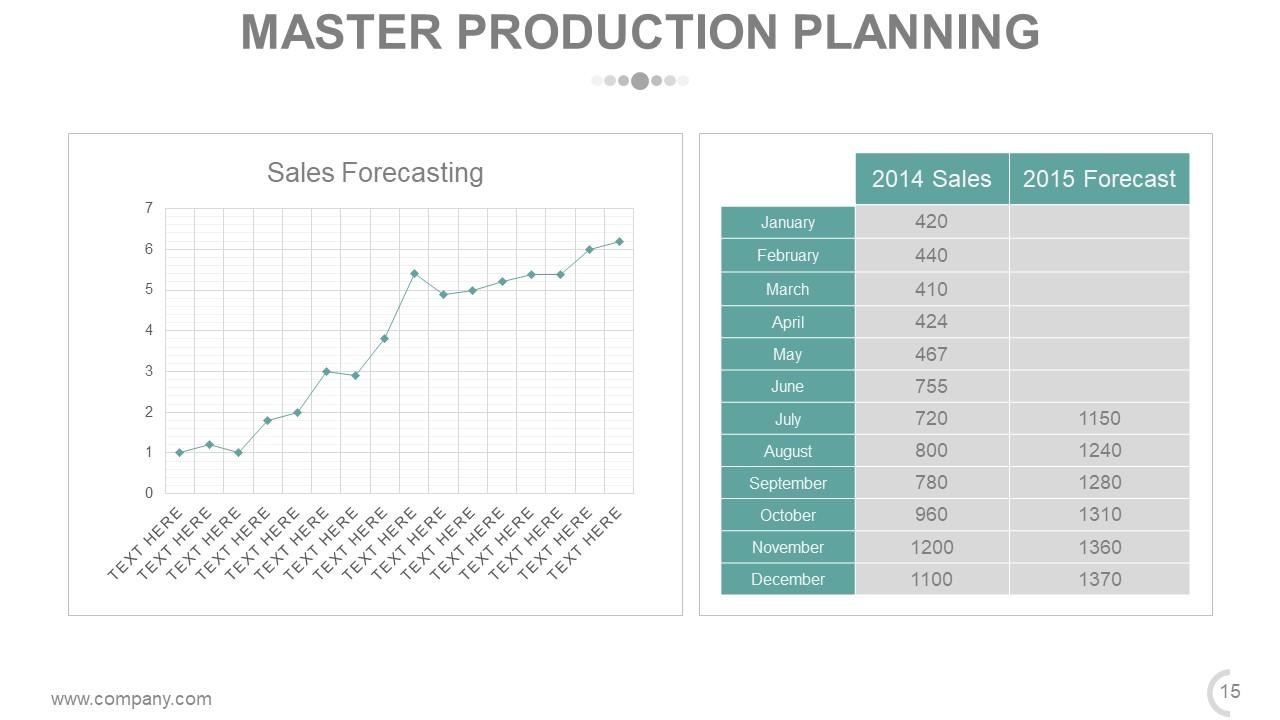
Slide 15: This slide also showcases Master Production Planning in tabular form.
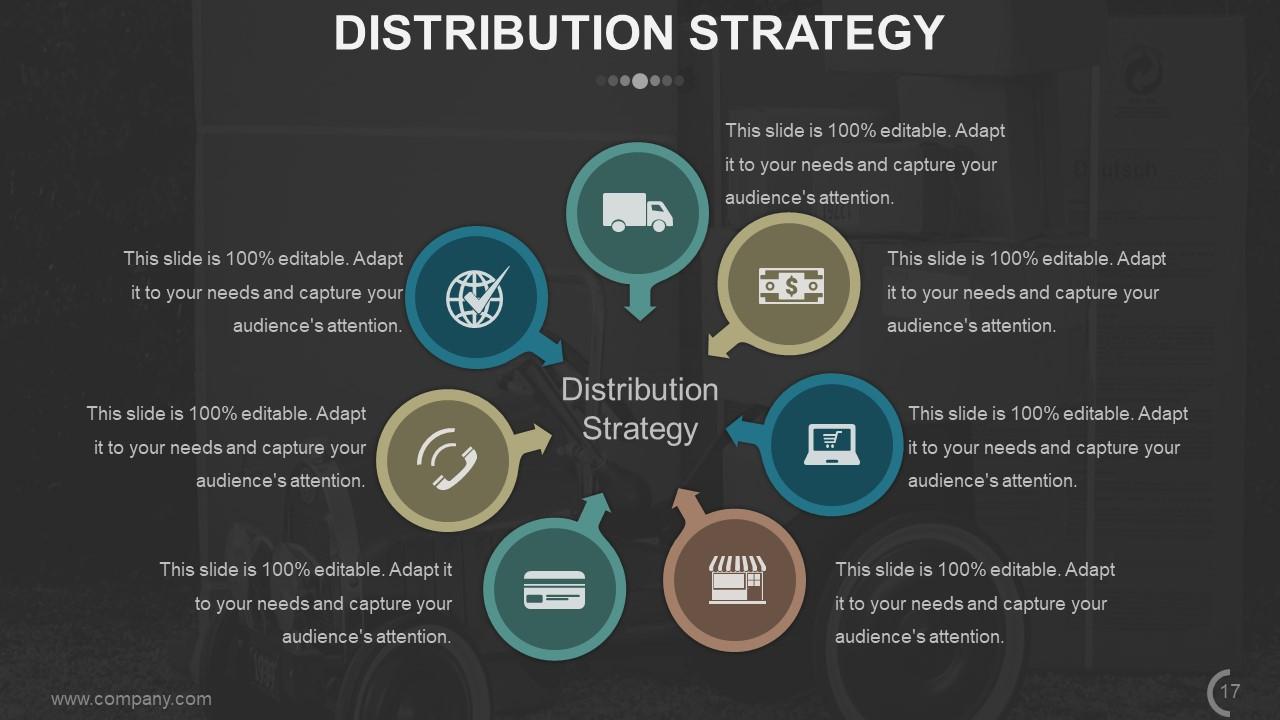
Slide 16: This slide presents Distribution Strategy to be displayed for future implementation.
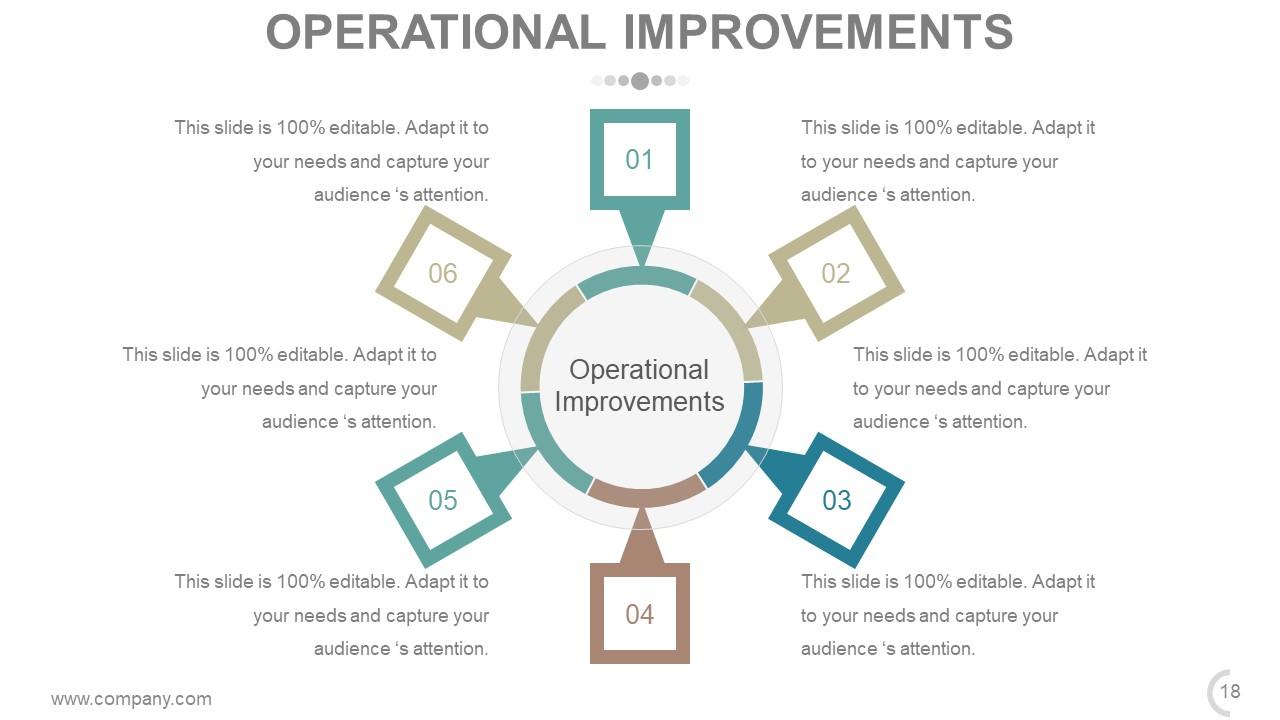
Slide 17: This slide shows Operational Improvements with a creative circular imagery.
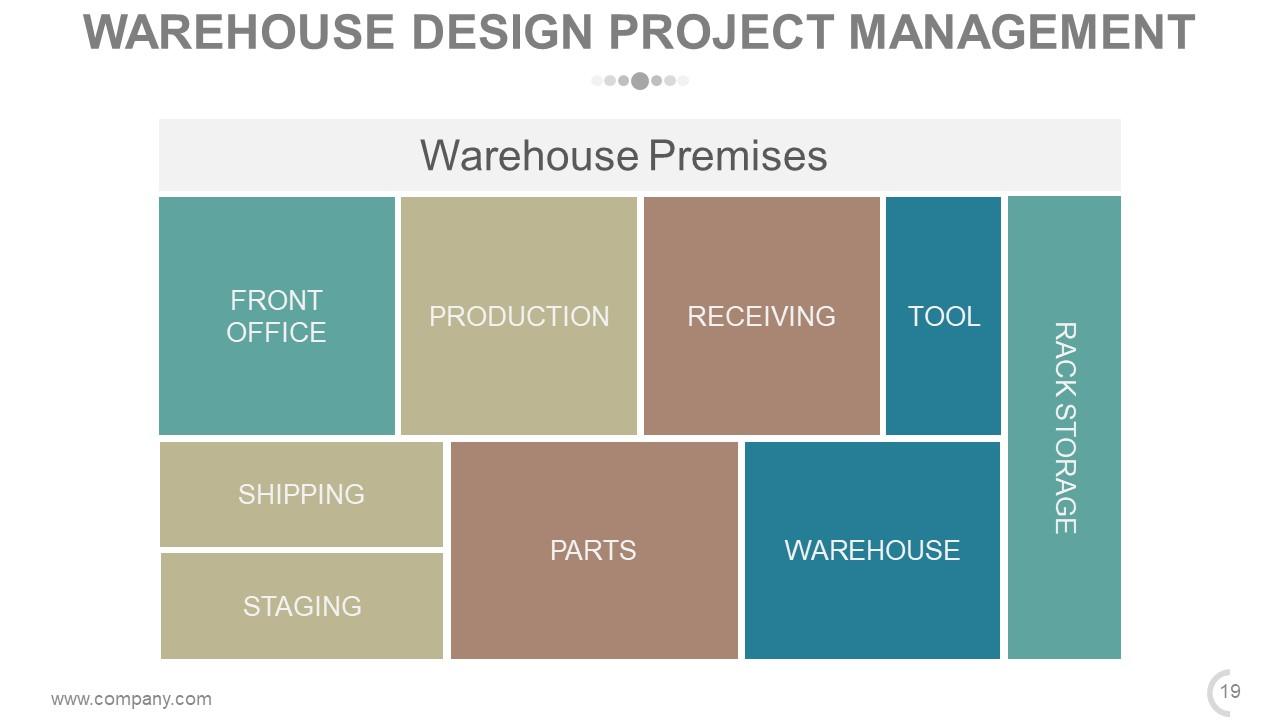
Slide 18: This slide presents Warehouse Design Project Management with the following- RACK STORAGE, FRONT OFFICE, TOOL, PRODUCTION, RECEIVING, WAREHOUSE, PARTS, STAGING, SHIPPING.
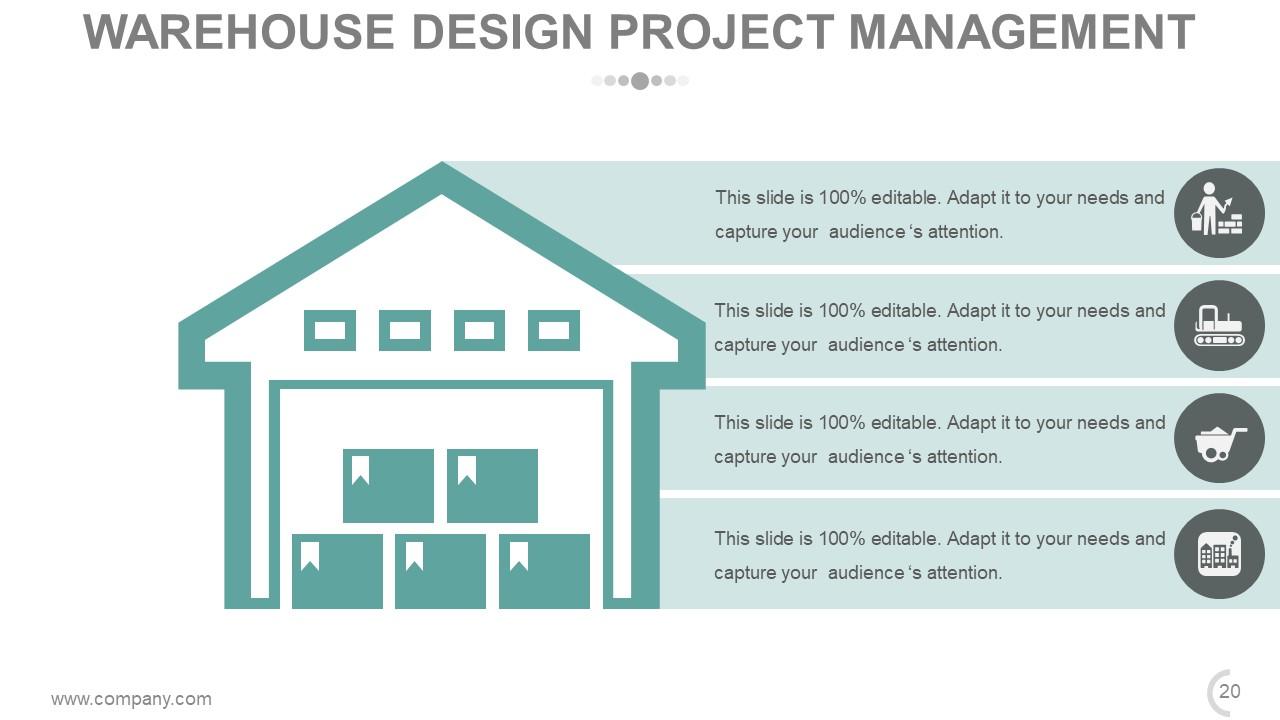
Slide 19: This slide presents Warehouse Design Project Management with a creative storage building imagery.
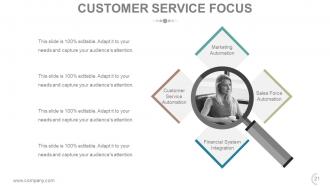
Slide 20: This slide shows Customer Service Focus displaying- Marketing Automation, Sales Force Automation, Financial System Integration, Customer Service Automation.
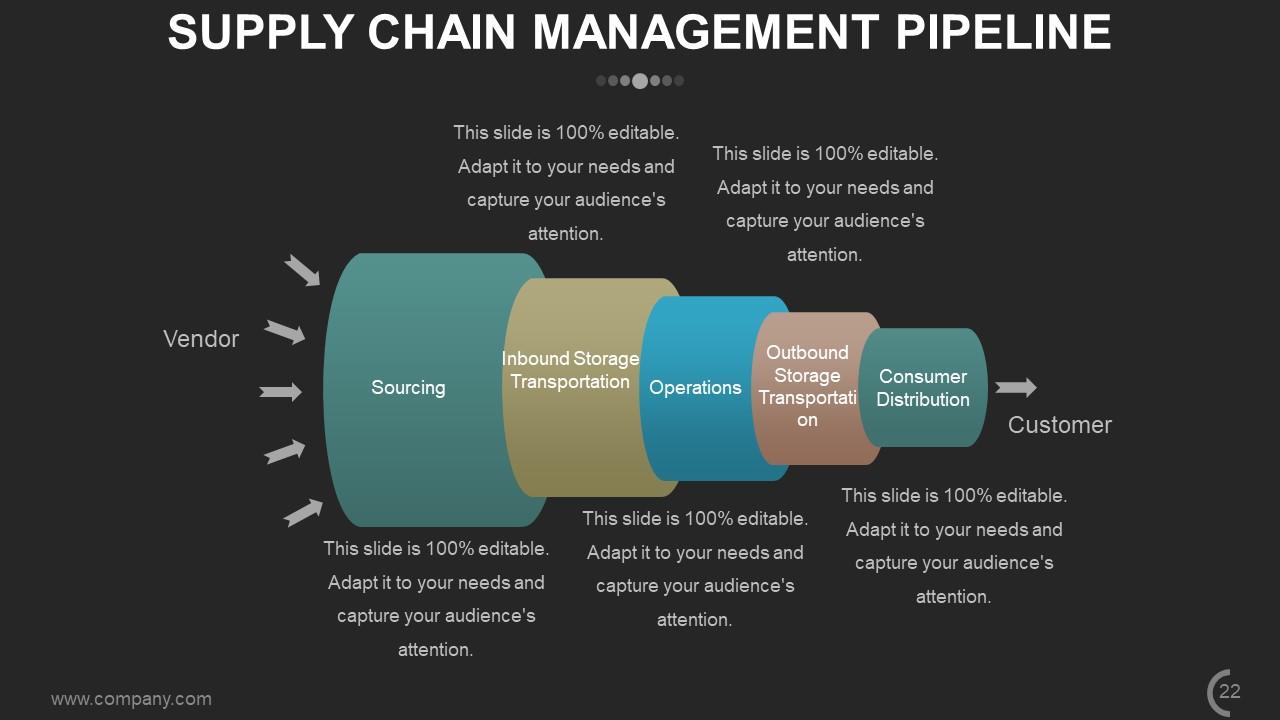
Slide 21: This slide presents Supply Chain Management Pipeline showing- Inbound Storage Transportation, Sourcing, Operations, Outbound Storage Transportation, Consumer Distribution, Vendor, Customer.
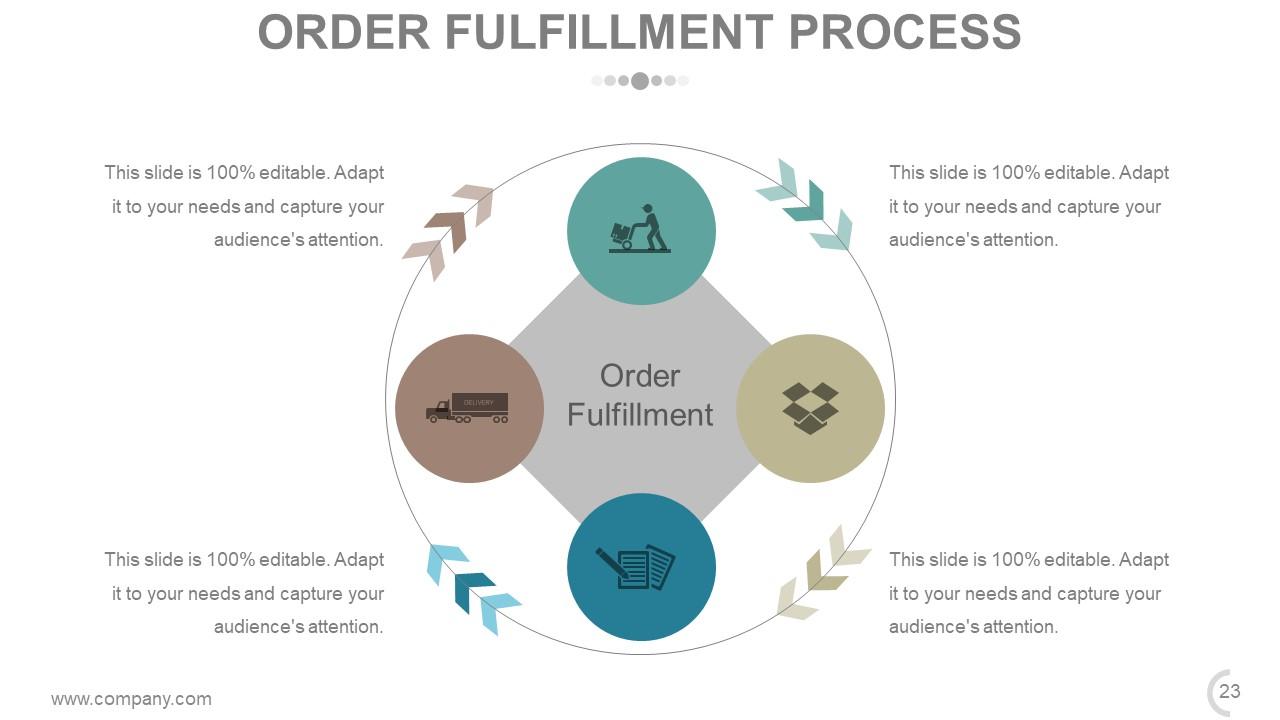
Slide 22: This slide showcases Order Fulfillment Process.
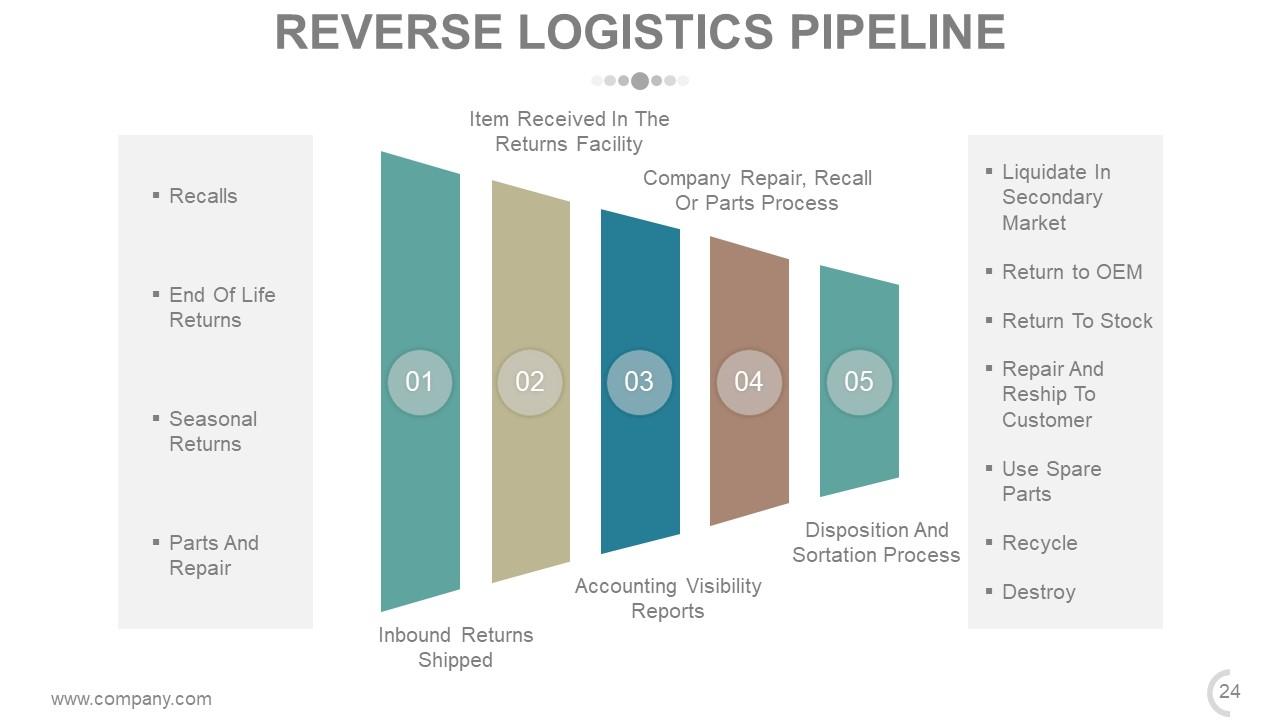
Slide 23: This slide presents Reverse Logistics Pipeline showing- Item Received In The Returns Facility, Company Repair, Recall Or Parts Process, Accounting Visibility Reports, Inbound Returns Shipped, Disposition And Sortation Process, Recalls, End Of Life Returns, Seasonal Returns, Parts And Repair, Return To Stock, Return to OEM, Liquidate In Secondary Market, Repair And Reship To Customer, Use Spare Parts, Recycle, Destroy.
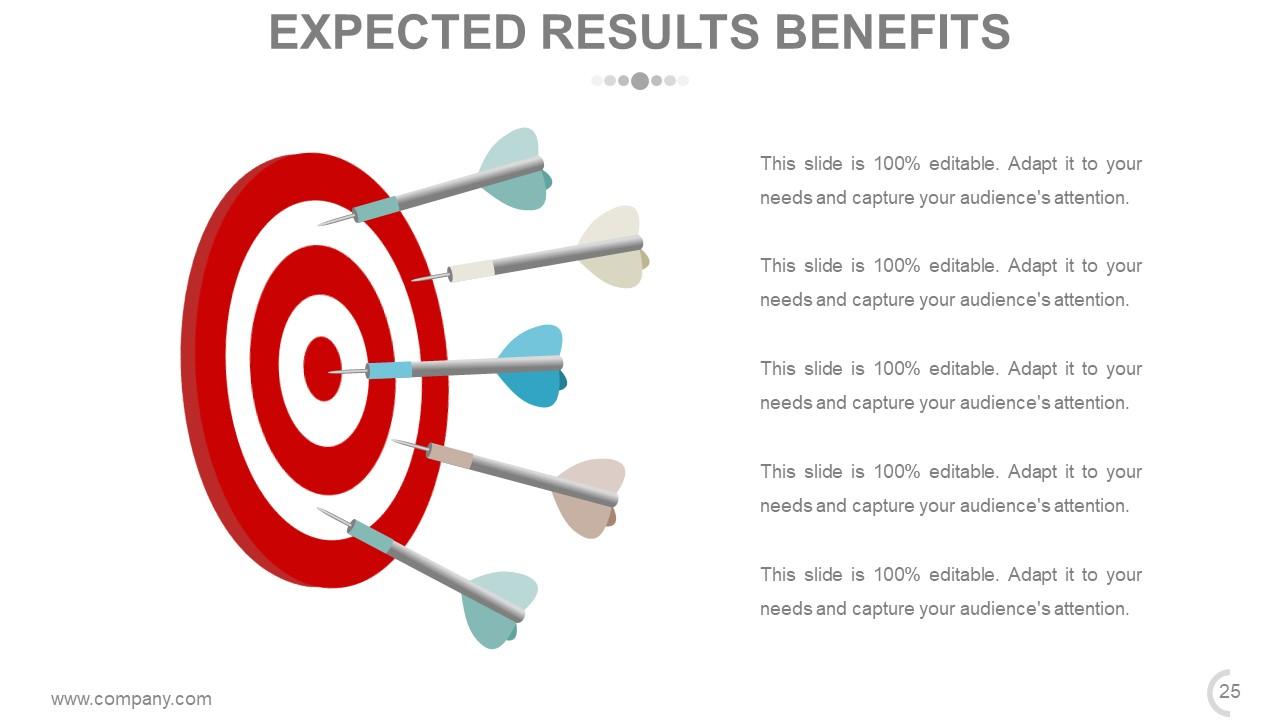
Slide 24: This slide presents Expected Results Benefits in target imagery form. State benefits etc. here.
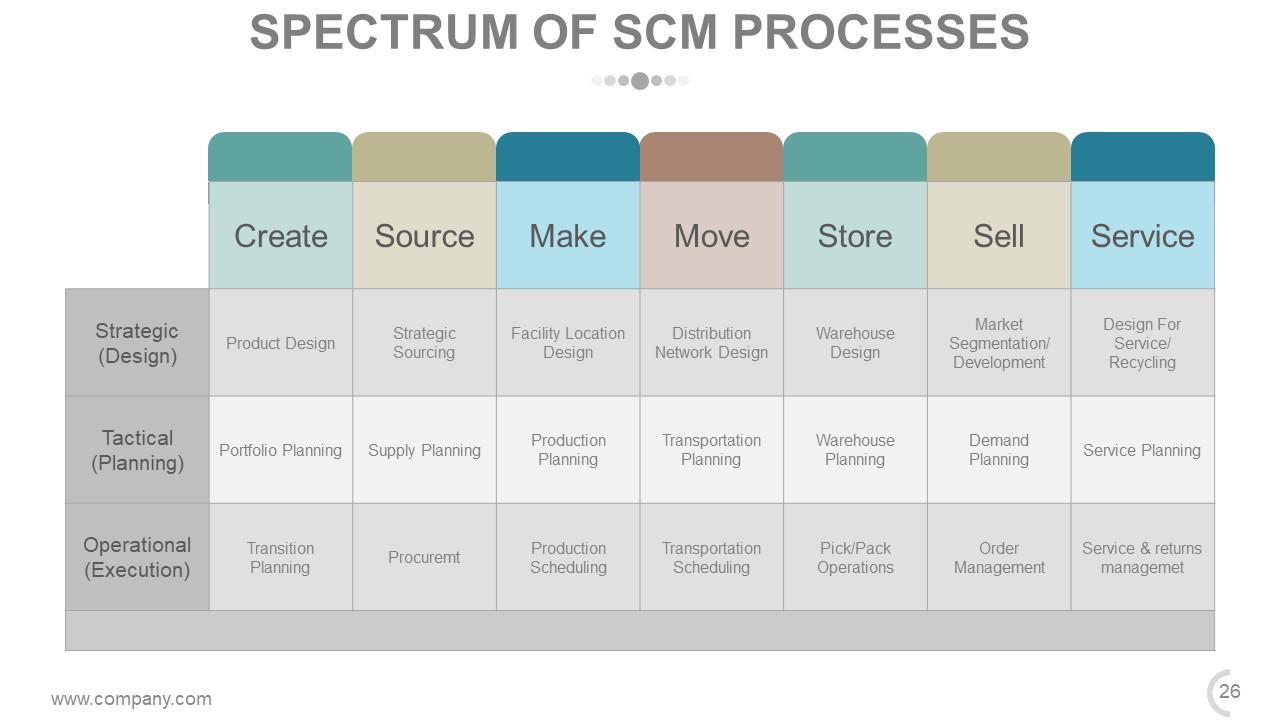
Slide 25: This slide showcases Spectrum Of SCM Processes in tabular form.
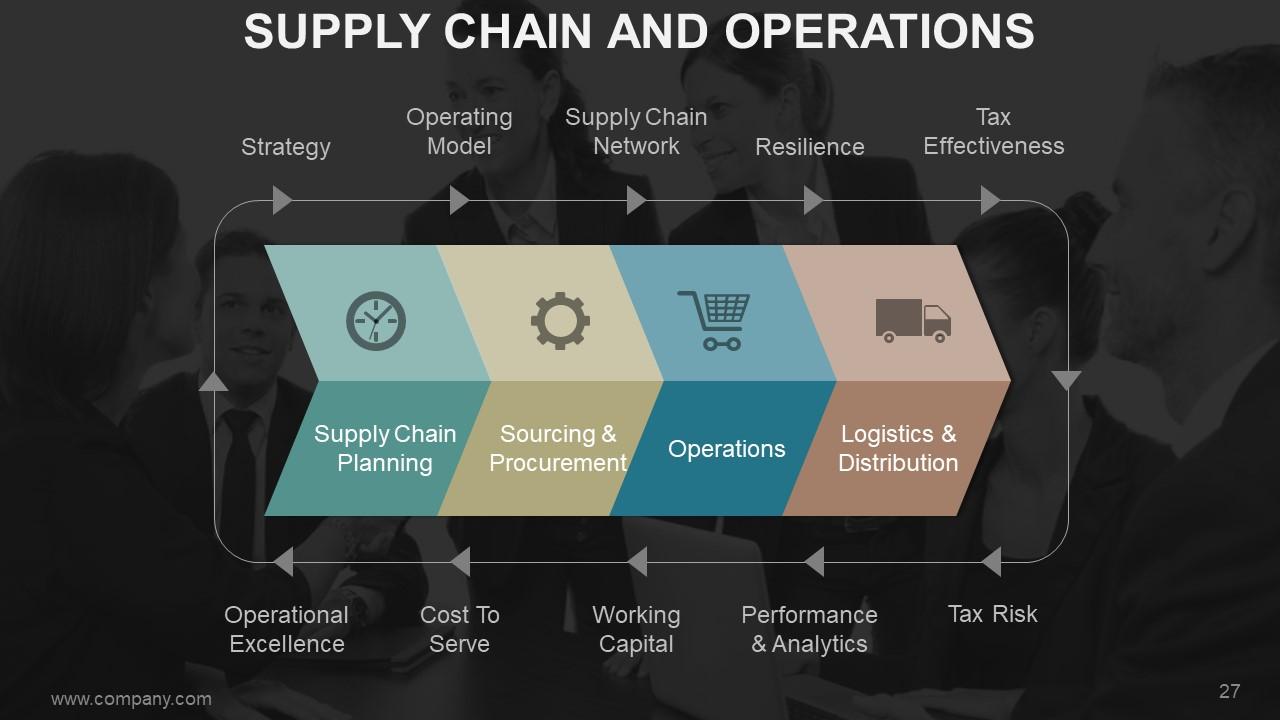
Slide 26: This slide shows Supply Chain and Operations displaying- Strategy, Operating Model, Supply Chain Network, Resilience, Tax Effectiveness, Operational Excellence, Cost To Serve, Working Capital, Performance & Analytics, Tax Risk Supply Chain Planning, Sourcing & Procurement, Operations, Logistics & Distribution.
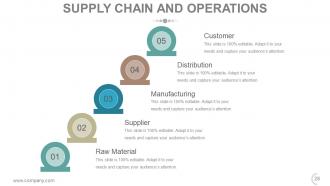
Slide 27: This slide shows Supply Chain and Operations with the following points- Customer, Raw Material, Supplier, Manufacturing, Distribution.
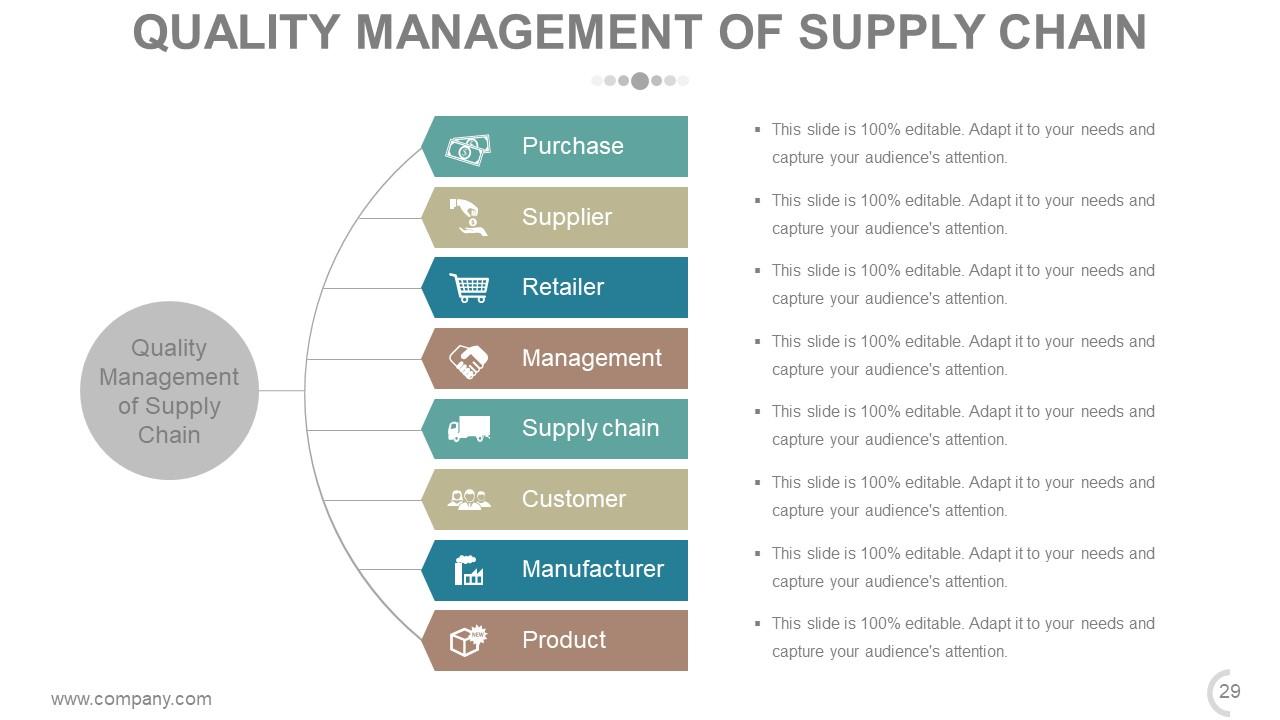
Slide 28: This slide showcases Quality Management of Supply Chain with the following points- Retailer, Purchase, Management, Supplier, Supply chain, Customer, Manufacturer, Product.
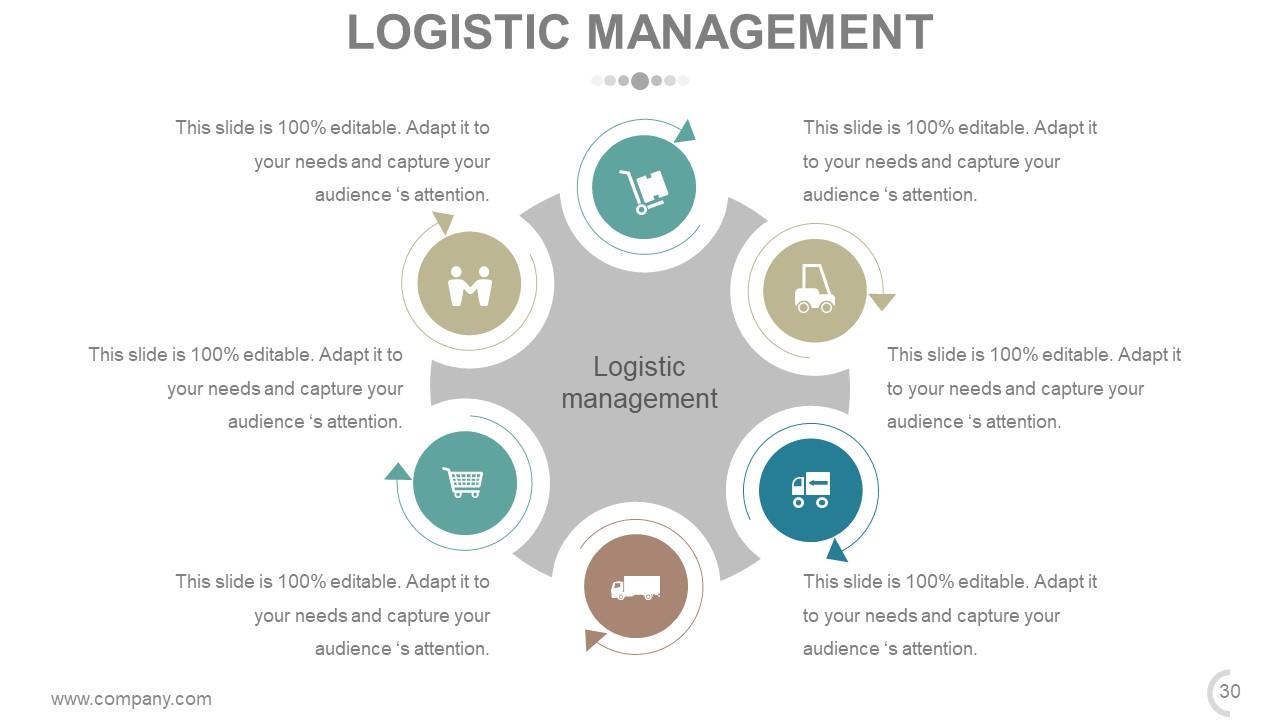
Slide 29: This slide displays Logistic management with creative icon imagery to go with.
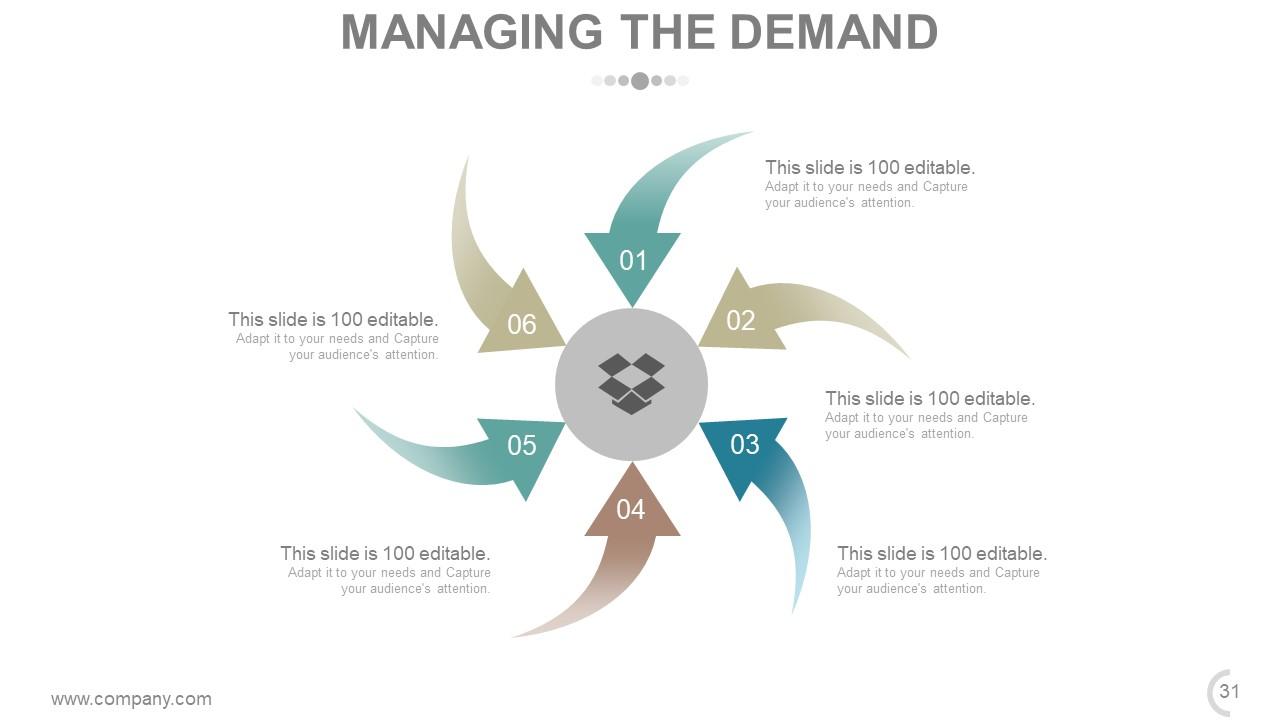
Slide 30: This slide shows Managing the Demand. State demand managing aspects etc. here.
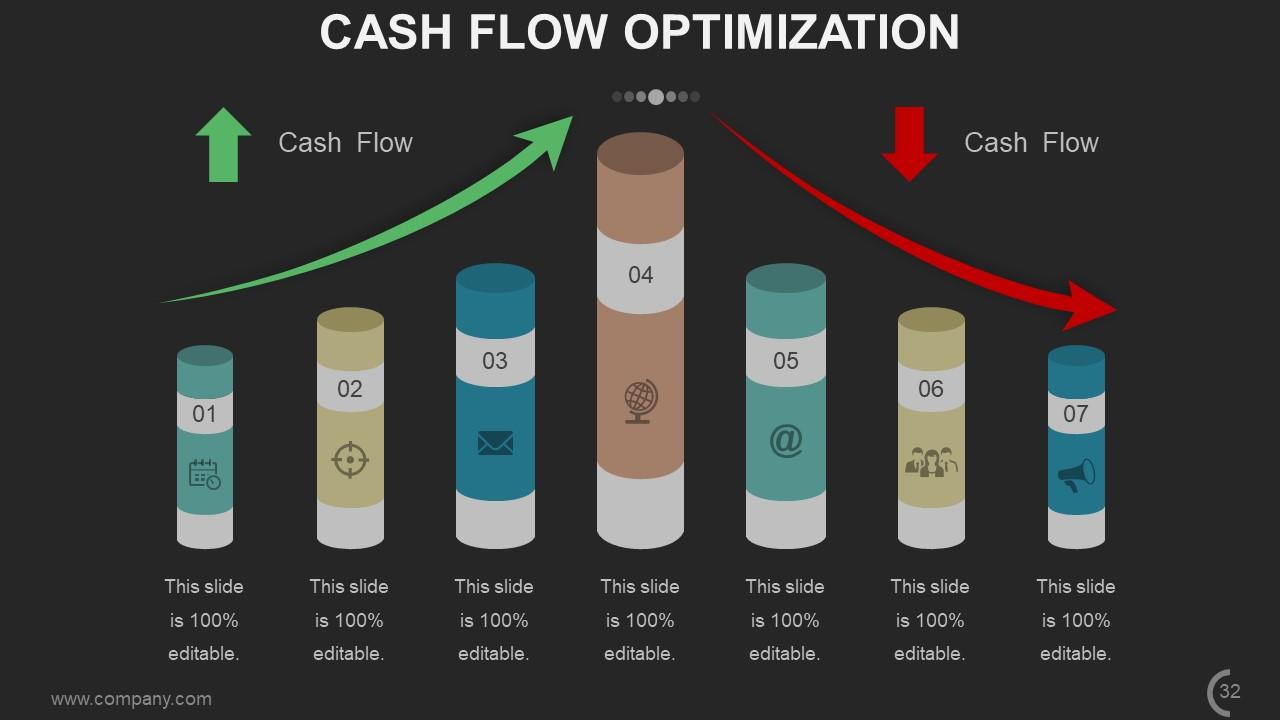
Slide 31: This slide displays Cash Flow Optimization in a creative bar graph form.
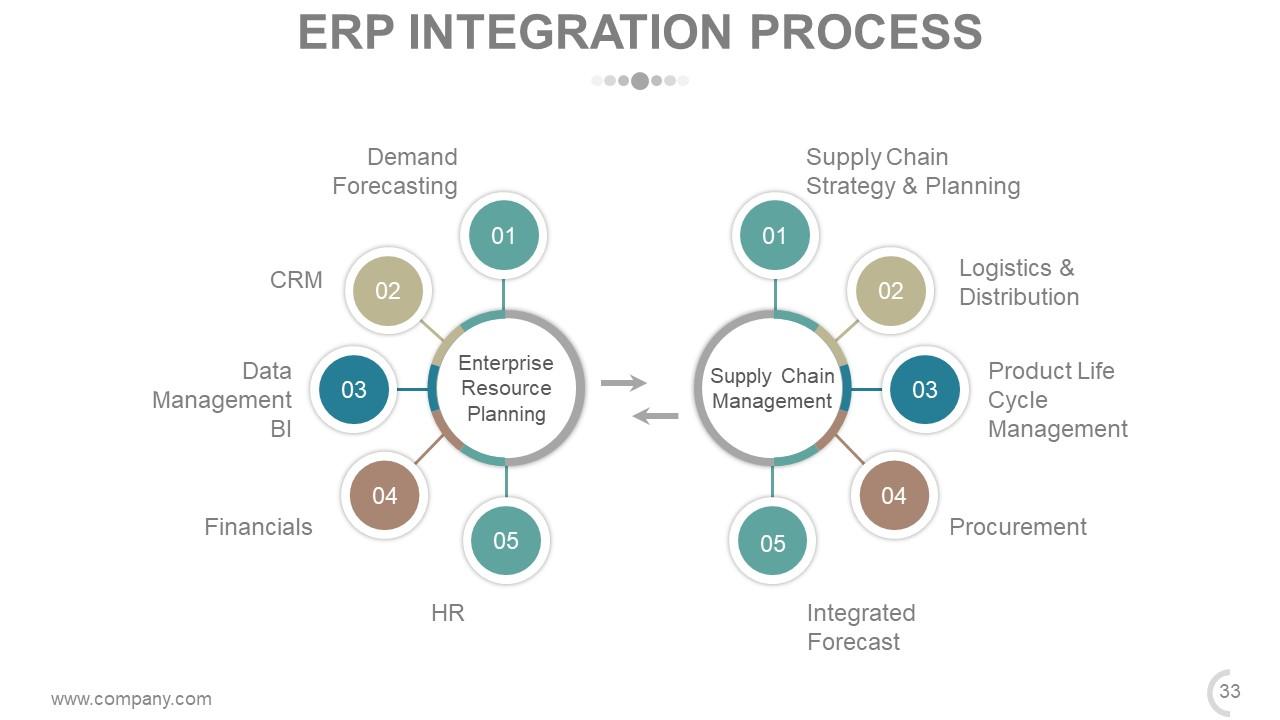
Slide 32: This slide shows ERP Integration Process displaying- Supply Chain Management: Supply Chain Strategy & Planning, Logistics & Distribution, Product Life Cycle Management, Procurement, Integrated Forecast. Enterprise Resource Planning: CRM, Data Management BI, Financials, HR, Demand Forecasting.
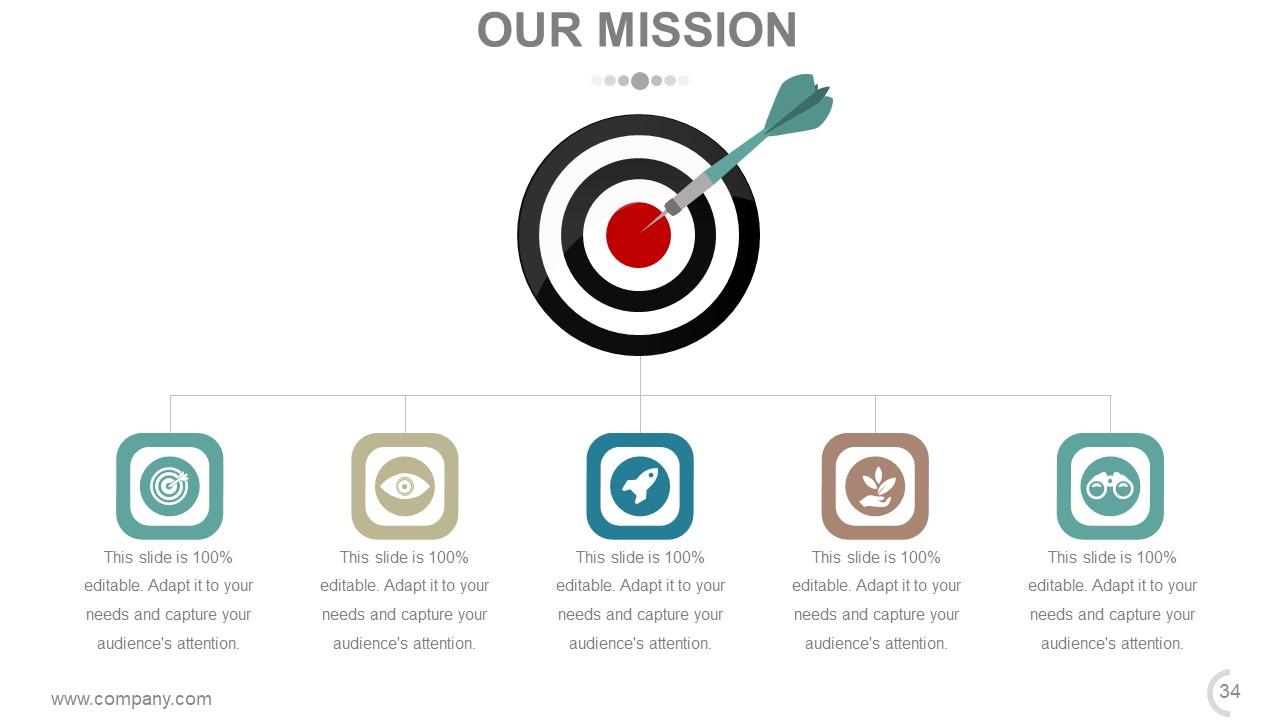
Slide 33: This slide contains Our Mission with imagery. State it here.
Slide 34: This slide is titled Additional slides. You can change the slide content as per need.
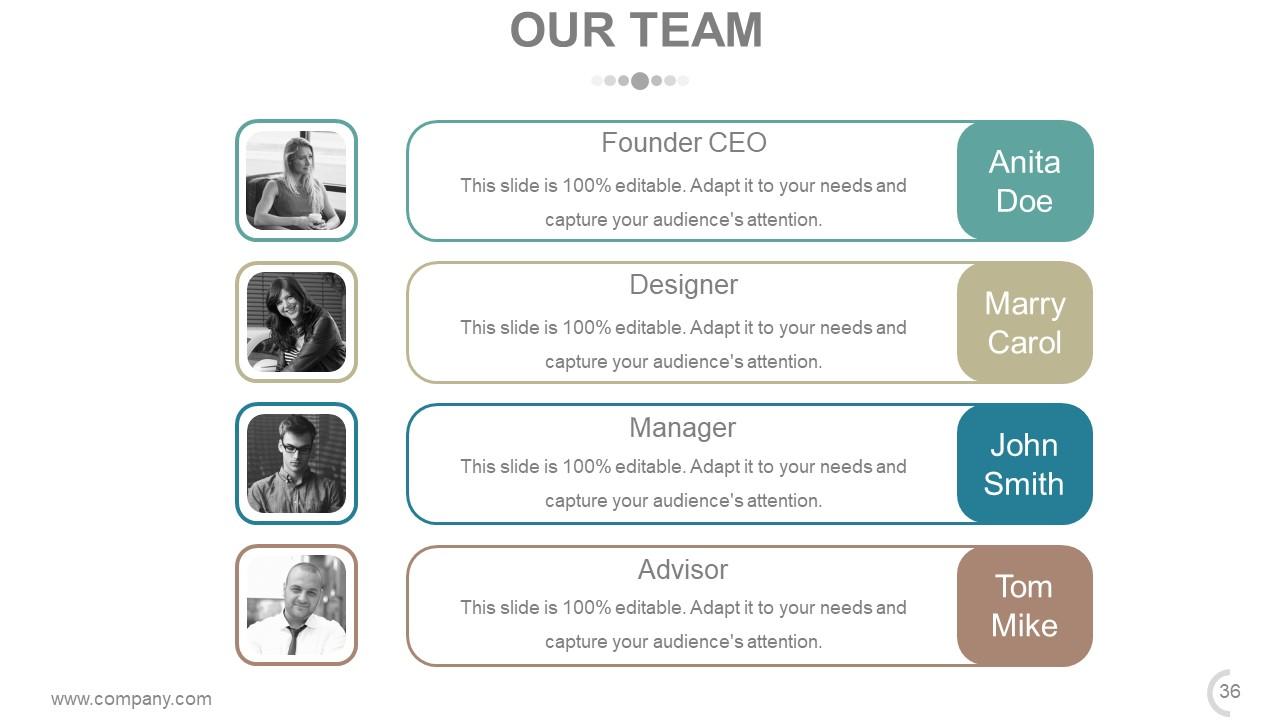
Slide 35: This is Our team slide with names and designation to fill information for.
Slide 36: This is an About us slide. State team/company specifications here.
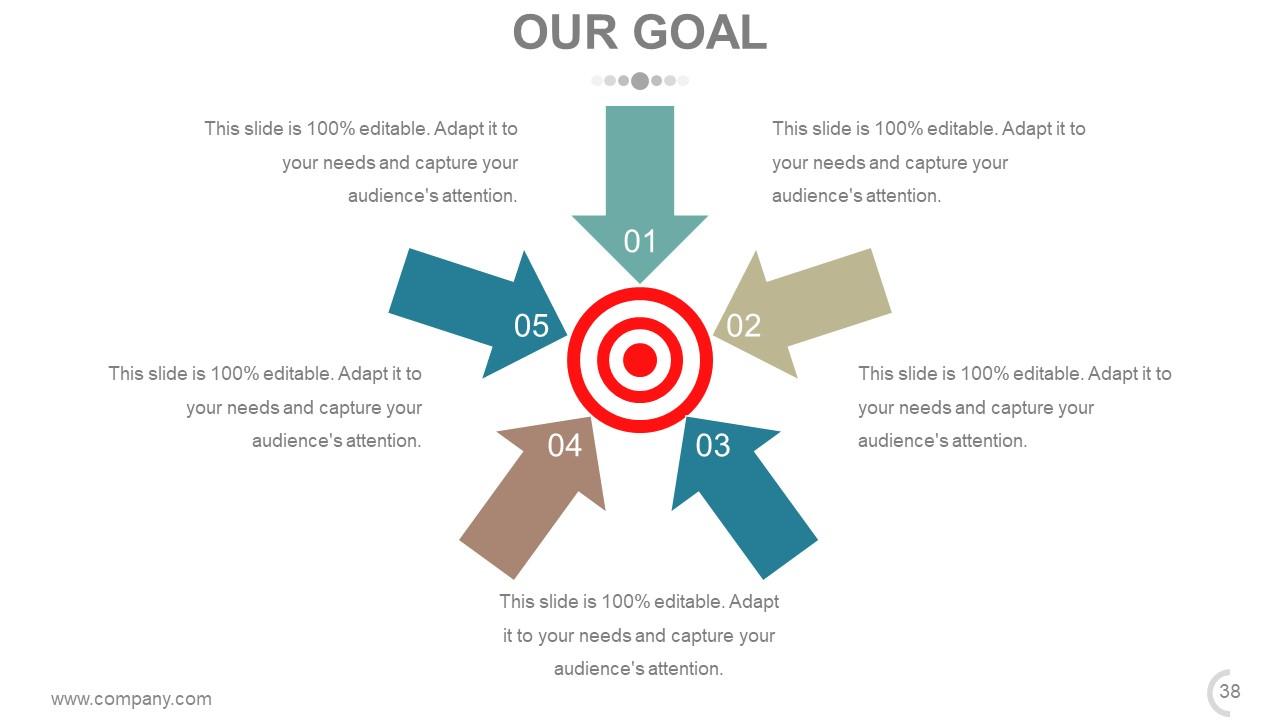
Slide 37: This is Our Goal slide. State goals, targets etc. here.
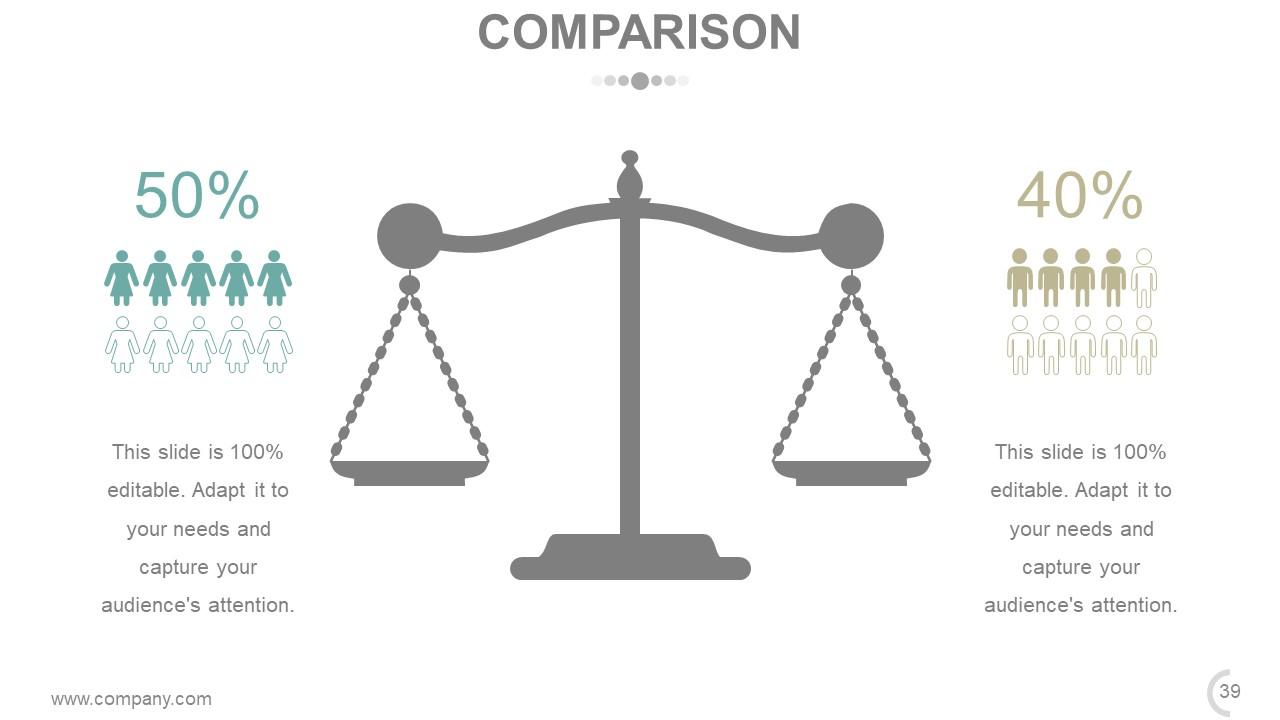
Slide 38: This is a Comparison slide to show comparison, information, specifications etc.
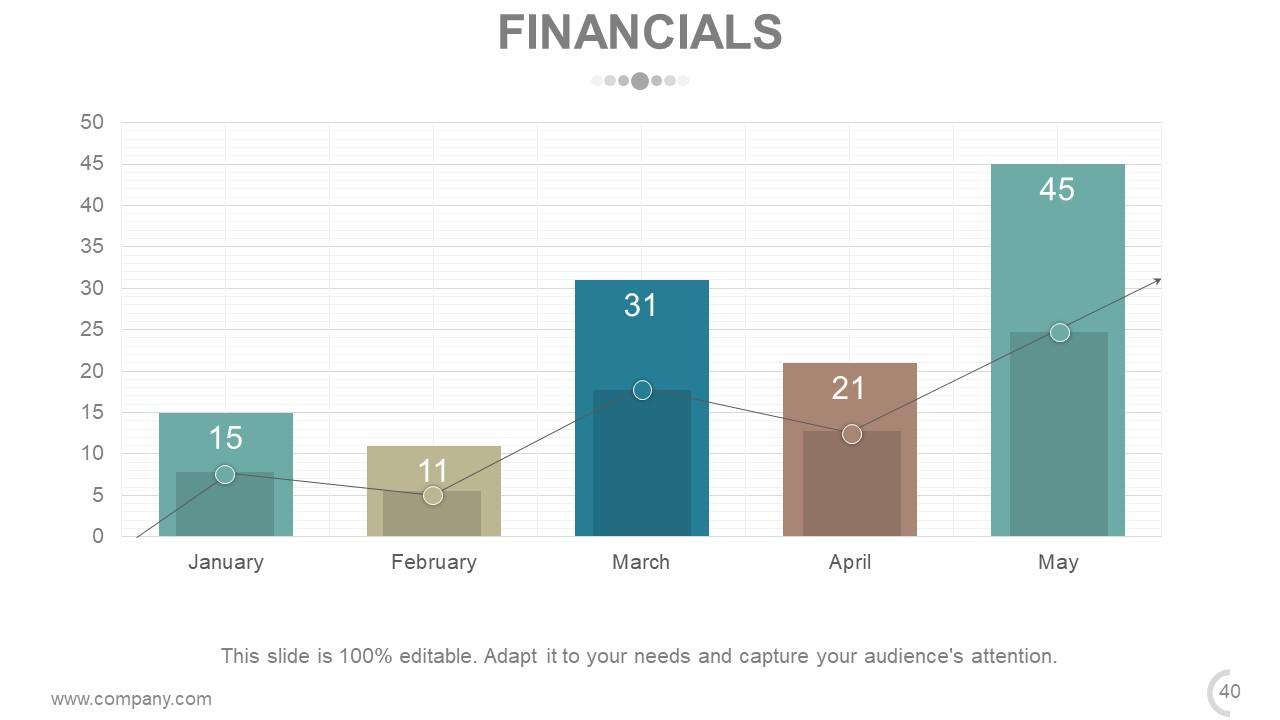
Slide 39: This is a Financial Score slide. State financial aspects etc. here.
Slide 40: This is a Quotes slide. Convey message, beliefs etc. here.
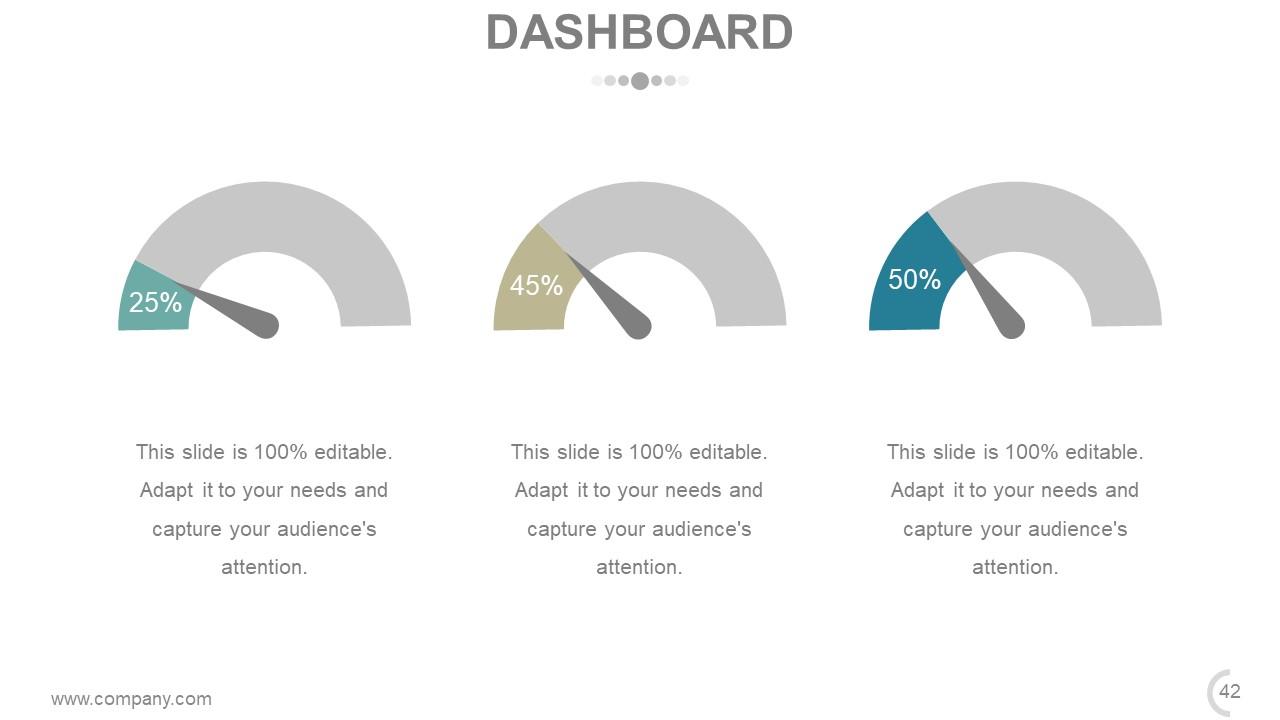
Slide 41: This is a Dashboard slide for showing information, specifications etc.
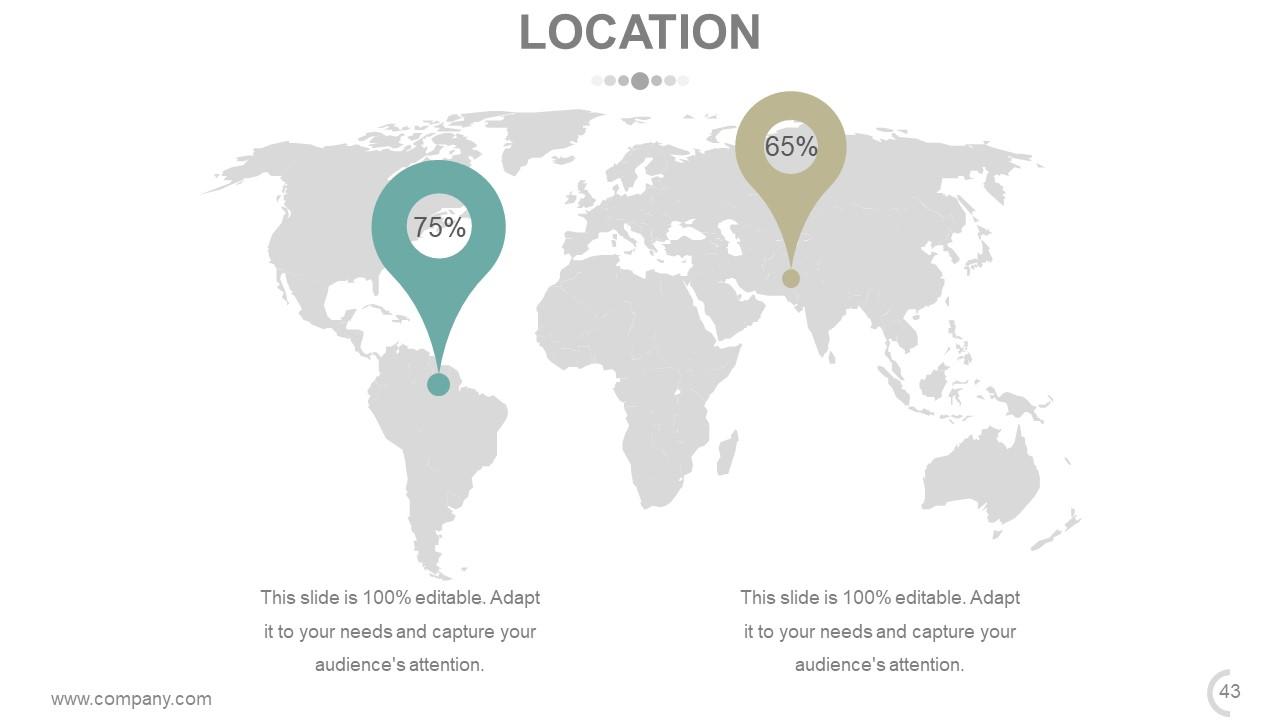
Slide 42: This is a Location slide of world map top show global marketing, growth, presence etc.
Slide 43: This is a Post It Notes slide to mark reminders, events, highlights etc.
Slide 44: This is a Newspaper slide to show important information etc. You may alter the slide content as per need.
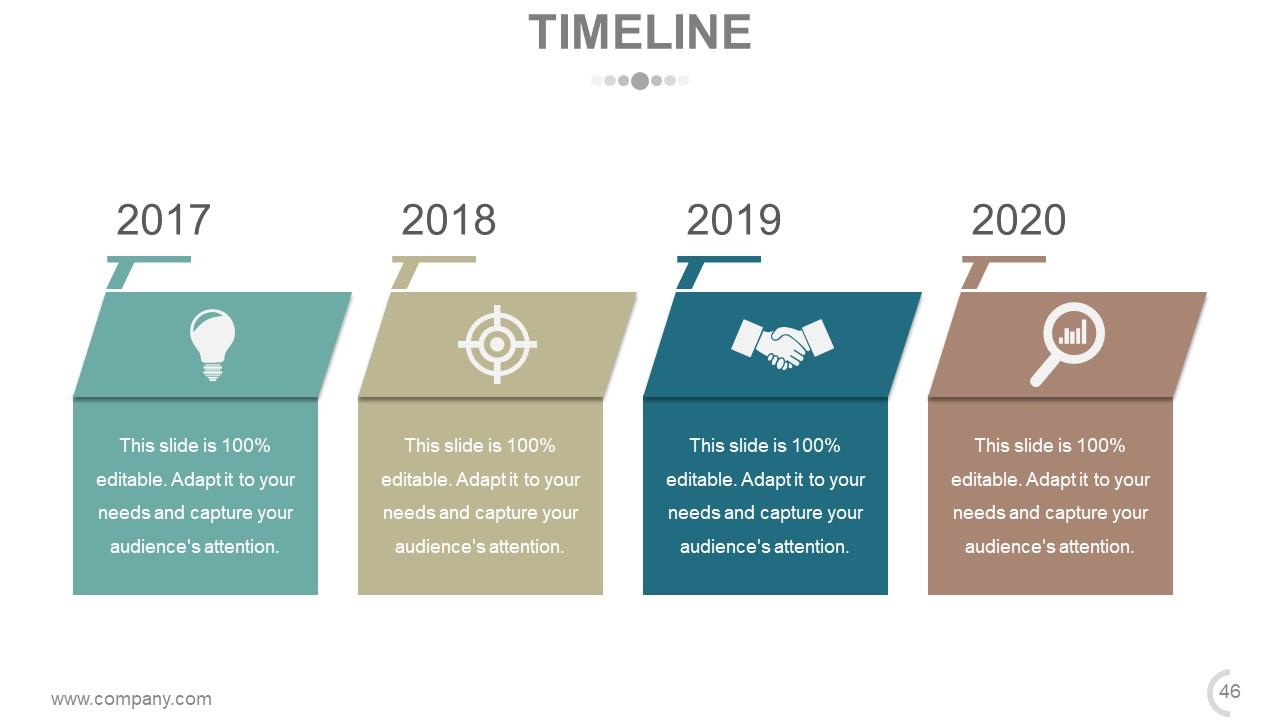
Slide 45: This is a Timeline slide to show milestones, evolution, growth highlights etc.
Slide 46: This is a Puzzle image slide. State information, specifications etc. here.
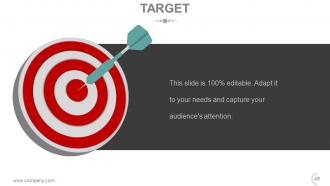
Slide 47: This is a Target image slide. State your targets, goals etc. here.
Slide 48: This is a Circular image slide. State information, specifications etc. here.
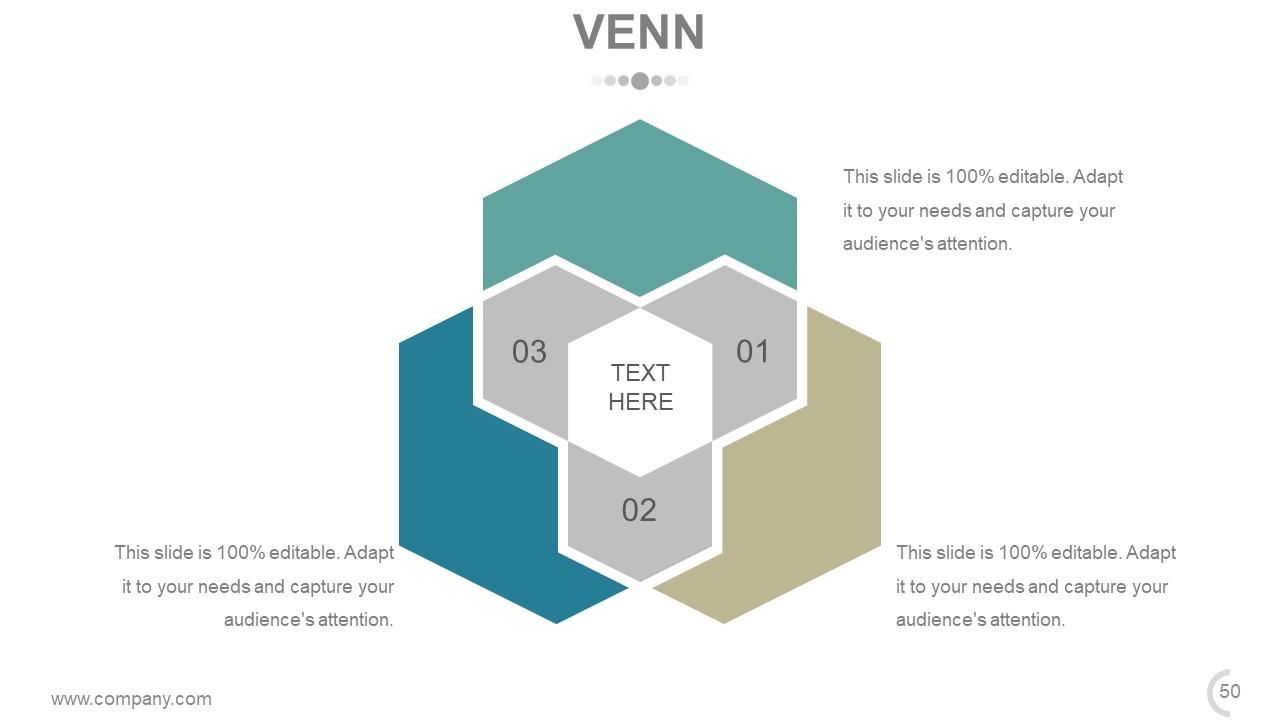
Slide 49: This is a Venn diagram image slide. State information, specifications etc. here.
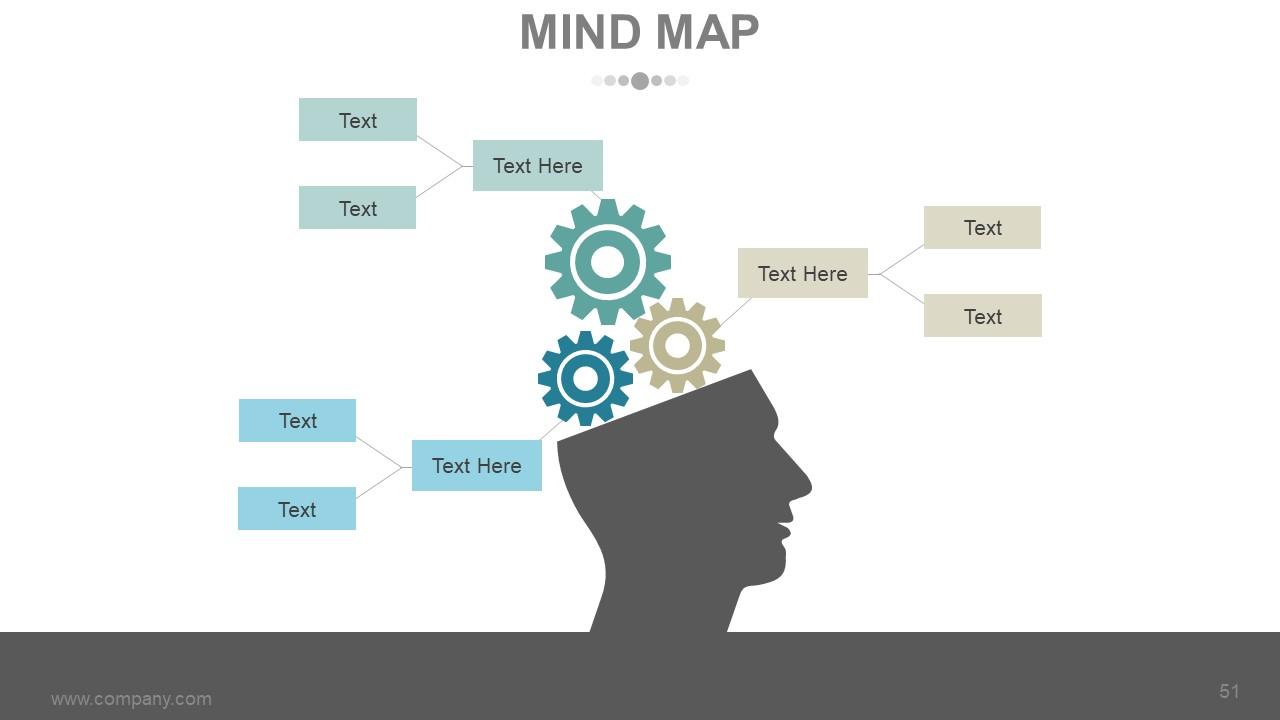
Slide 50: This is a Mind Map image slide to show information, segregation, specifications etc.
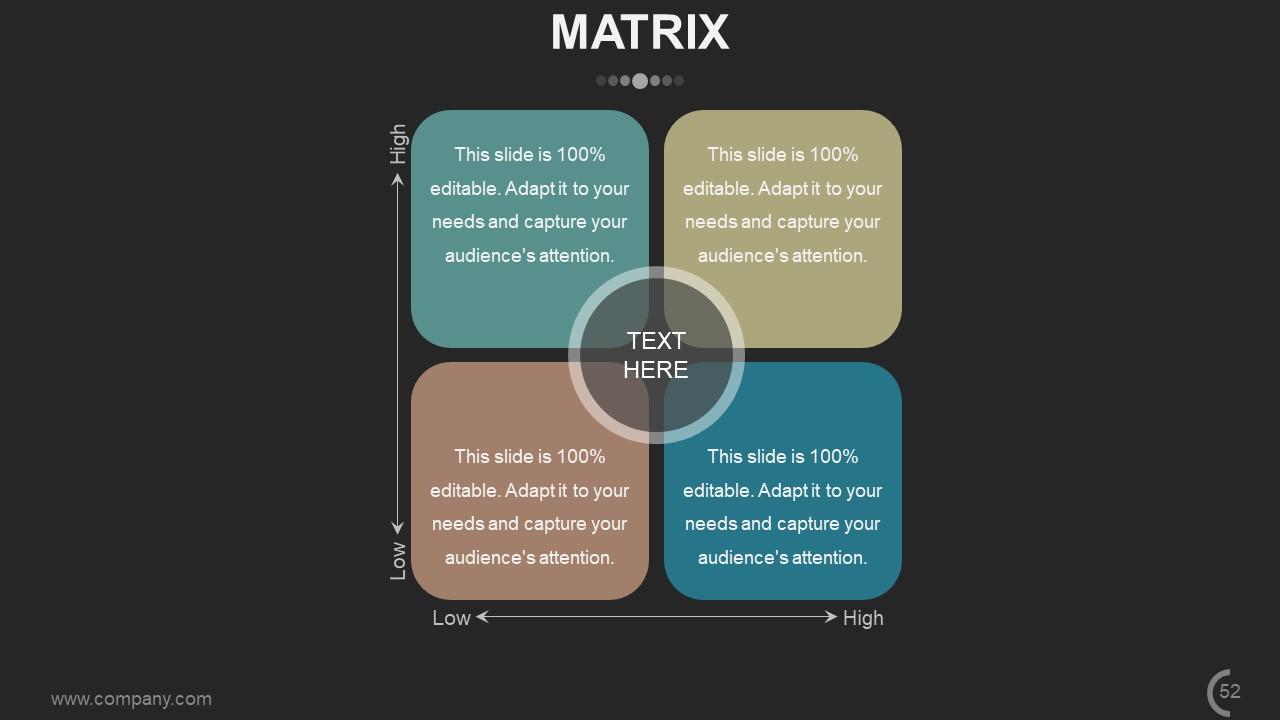
Slide 51: This slide presents a Low High Matrix for representing an information.
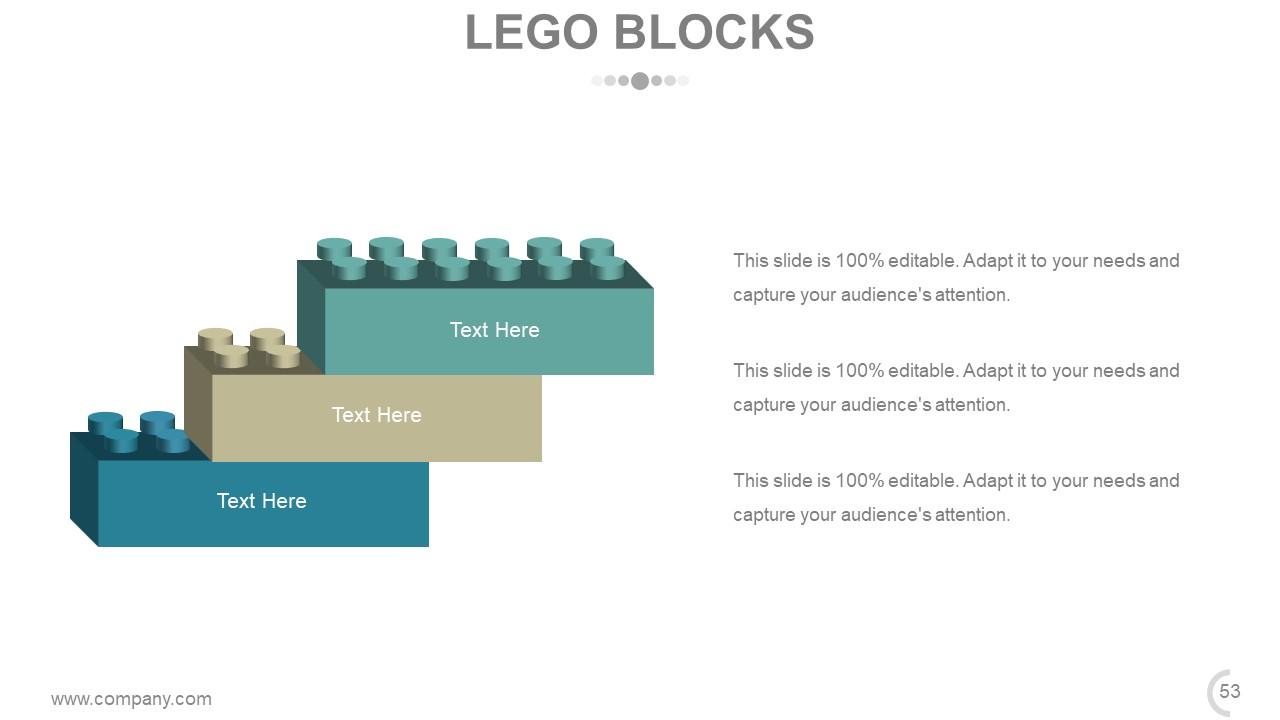
Slide 52: This is a Lego Blocks image slide with text boxes to show information, specifications etc.
Slide 53: This slide presents Silhouettes with text boxes. State people related information, specifications etc. here.
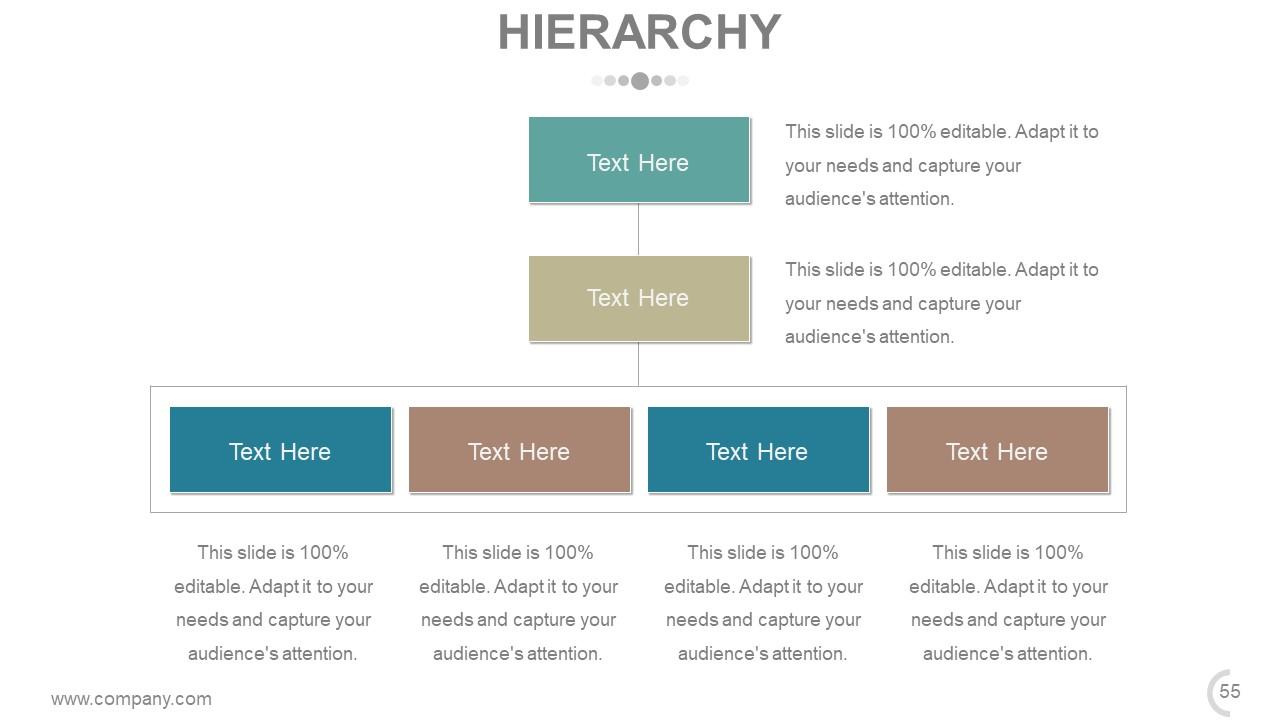
Slide 54: This is a Hierarchy slide with text boxes to show information, organization/team specifications etc.
Slide 55: This is a Bulb or Idea slide to state a new idea or highlight innovative specifications/information etc.
Slide 56: This is a Magnifying Glass image slide to show information, specifications etc.
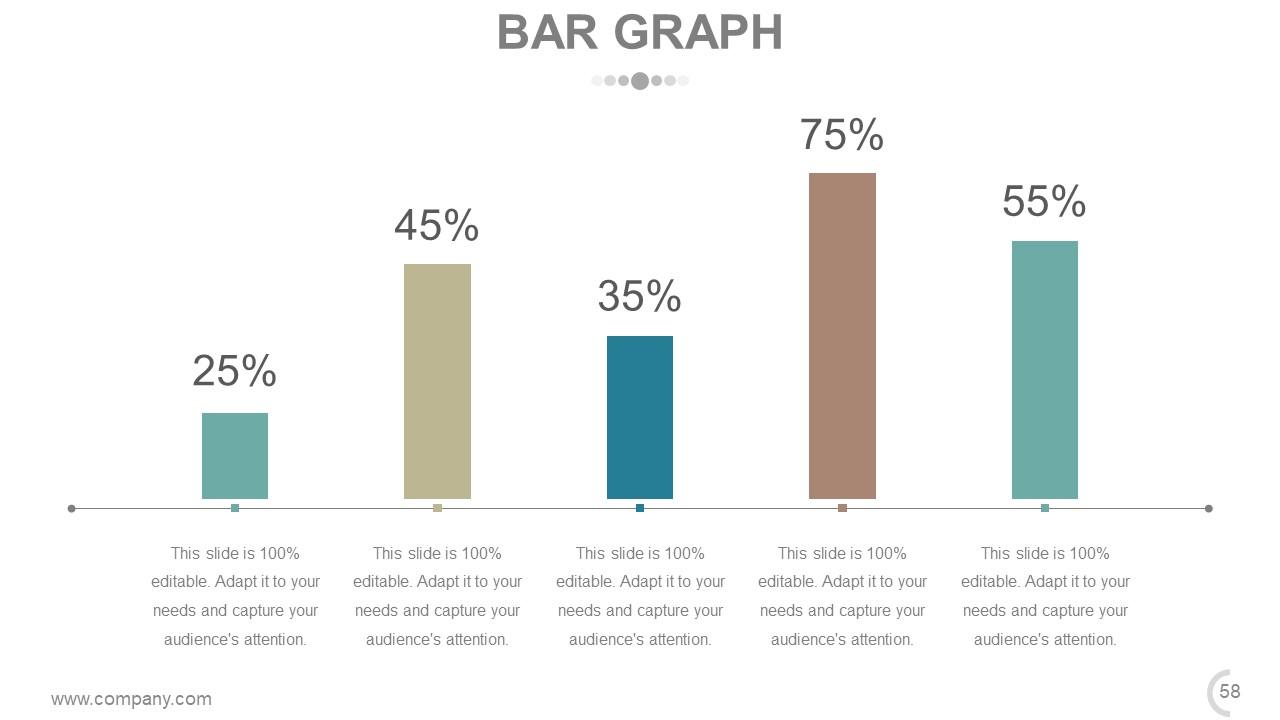
Slide 57: This is a Bar Graph slide to show product/entity comparison, specifications etc.
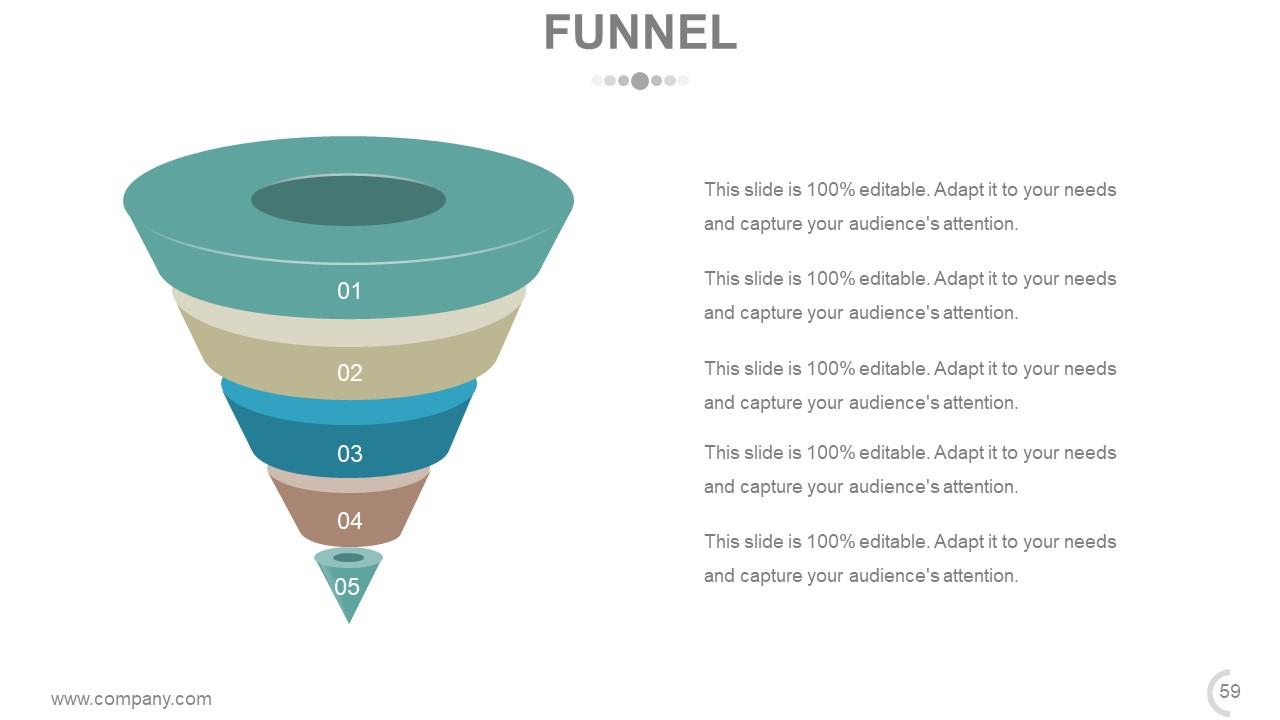
Slide 58: This slide displays a Funnel image. State information, funneling aspects etc. here.
Slide 59: This is a Thank You slide with Address# street number, city, state, Contact Numbers, Email Address.
Supply Chain Kpi Dashboard Powerpoint Presentation Slides with all 60 slides:
Don't allow folks to feel alienated with our Supply Chain Kpi Dashboard Powerpoint Presentation Slides. They ensure differences aren't created.
-
Easily Editable.
-
Colors used are bright and distinctive.


