Business financial trend analysis dashboard with sales performance
Our Business Financial Trend Analysis Dashboard With Sales Performance are topically designed to provide an attractive backdrop to any subject. Use them to look like a presentation pro.
Our Business Financial Trend Analysis Dashboard With Sales Performance are topically designed to provide an attractive back..
- Google Slides is a new FREE Presentation software from Google.
- All our content is 100% compatible with Google Slides.
- Just download our designs, and upload them to Google Slides and they will work automatically.
- Amaze your audience with SlideTeam and Google Slides.
-
Want Changes to This PPT Slide? Check out our Presentation Design Services
- WideScreen Aspect ratio is becoming a very popular format. When you download this product, the downloaded ZIP will contain this product in both standard and widescreen format.
-

- Some older products that we have may only be in standard format, but they can easily be converted to widescreen.
- To do this, please open the SlideTeam product in Powerpoint, and go to
- Design ( On the top bar) -> Page Setup -> and select "On-screen Show (16:9)” in the drop down for "Slides Sized for".
- The slide or theme will change to widescreen, and all graphics will adjust automatically. You can similarly convert our content to any other desired screen aspect ratio.
Compatible With Google Slides

Get This In WideScreen
You must be logged in to download this presentation.
PowerPoint presentation slides
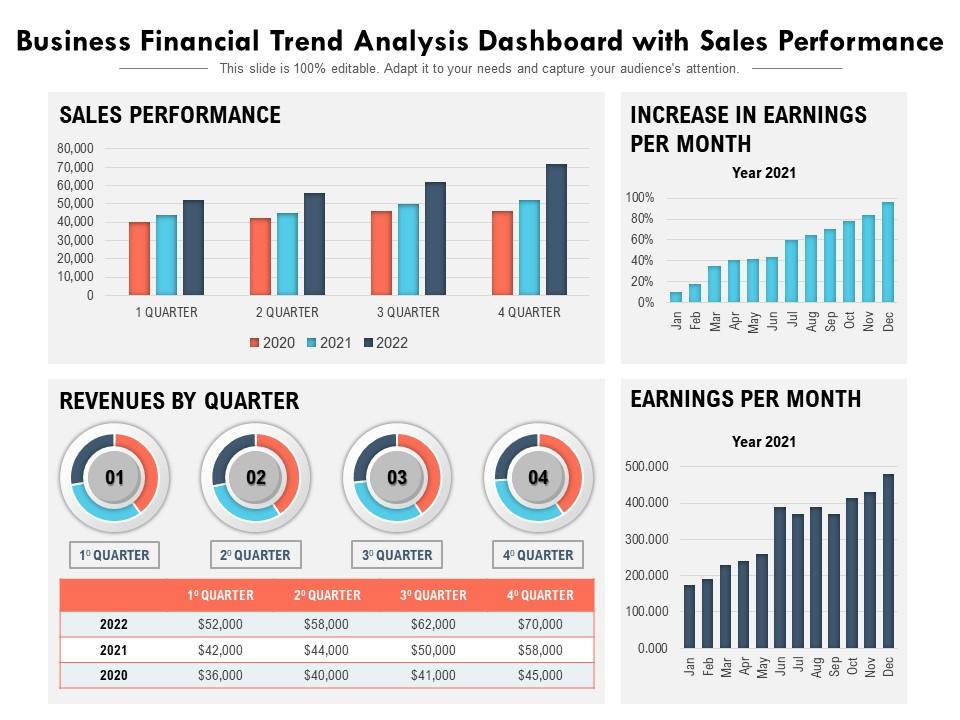
Presenting this set of slides with name Business Financial Trend Analysis Dashboard With Sales Performance. The topics discussed in these slides are Sales Performance, Revenues, Increase In Earnings. This is a completely editable PowerPoint presentation and is available for immediate download. Download now and impress your audience.
People who downloaded this PowerPoint presentation also viewed the following :
Content of this Powerpoint Presentation
Description:
The image is a PowerPoint slide titled "Business Financial Trend Analysis Dashboard with Sales Performance," which provides a visual representation of a company's sales and earnings data.
The slide is divided into three sections:
1. Sales Performance:
A bar chart compares quarterly sales over three years (2020, 2021, and 2022). Each quarter shows the progression or decline in sales, with each year represented by a different color.
2. Revenues by Quarter:
This section includes four donut charts for each quarter of the year, labeled Q1 through Q4. Inside each chart is the corresponding quarter and the revenue figures for 2020, 2021, and 2022, showcasing the growth or changes in revenue over the three years.
3. Increase in Earnings Per Month:
A bar chart for the year 2021 displays the monthly percentage increase in earnings, showing trends or anomalies throughout the year.
4. Earnings Per Month:
A bar chart showing the actual earnings figures per month for the year 2021, indicating the company's financial performance across each month.
Use Cases:
Industries where this type of financial trend analysis slide can be highly useful include:
1. Retail:
Use: Tracking monthly and quarterly sales performance.
Presenter: Sales Manager
Audience: Retail staff, management team
2. Manufacturing:
Use: Monitoring production costs and revenue.
Presenter: Chief Financial Officer
Audience: Investors, department managers
3. Technology:
Use: Analyzing product sales and revenue growth.
Presenter: Business Analyst
Audience: Executives, product teams
4. Healthcare:
Use: Reviewing the financial health of healthcare services.
Presenter: Healthcare Administrator
Audience: Hospital board, department heads
5. Automotive:
Use: Assessing the sales trends of different vehicle models.
Presenter: Marketing Director
Audience: Dealers, marketing team
6. Real Estate:
Use: Visualizing monthly sales and revenue from property deals.
Presenter: Real Estate Broker
Audience: Investors, sales agents
7. Hospitality:
Use: Evaluating the financial success of hospitality services.
Presenter: General Manager
Audience: Stakeholders, hotel/resort staff
Business financial trend analysis dashboard with sales performance with all 2 slides:
Use our Business Financial Trend Analysis Dashboard With Sales Performance to effectively help you save your valuable time. They are readymade to fit into any presentation structure.
-
Use of icon with content is very relateable, informative and appealing.
-
Great designs, Easily Editable.
-
Very well designed and informative templates.


