


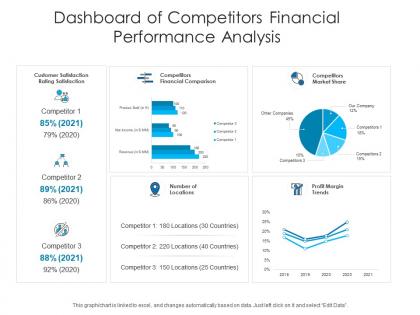
Dashboard of competitors financial performance analysis


Try Before you Buy Download Free Sample Product
 Impress Your
 Audience
Editable
of Time


Our Dashboard Of Competitors Financial Performance Analysis are topically designed to provide an attractive backdrop to any subject. Use them to look like a presentation pro.
People who downloaded this PowerPoint presentation also viewed the following :
Dashboard of competitors financial performance analysis with all 2 slides:
Use our Dashboard Of Competitors Financial Performance Analysis to effectively help you save your valuable time. They are readymade to fit into any presentation structure.

FAQs for Dashboard of competitors
Honestly, just pick 5-6 metrics to start with or you'll go crazy trying to track everything. Revenue growth and profit margins (both gross and net) are obvious must-haves. Market share trends tell you who's actually winning. I always look at cash flow ratios too - companies can fake profits but cash doesn't lie. ROE and debt-to-equity give you the financial health picture. Oh, and revenue per employee is pretty solid for efficiency comparisons. Just make sure you're comparing the same time periods across similar business models. You can always add more metrics later once you spot some patterns.
Look, revenue trends are basically your crystal ball for seeing who's crushing it and who's not in your space. When one competitor keeps outpacing everyone else, that's your cue to figure out their secret sauce - could be they found a goldmine segment or cracked some pricing code you haven't thought of. But here's the thing: if growth is tanking across the board except for one lucky player, your market might be hitting a wall. You want to catch these shifts early so you can jump on opportunities or bail before things get ugly. Honestly, it's one of those things that seems obvious but most people ignore until it's too late.
Honestly, dashboards are so much better than drowning in Excel sheets. You'll spot who's winning market share way faster, plus track revenue trends without going cross-eyed. Cash flow problems? You'll see those coming before everyone else catches on. What I really love is catching weird stuff - like when competitors randomly dump money into R&D, which usually means they're cooking up something big. You can slice data however you want without rebuilding everything from scratch each time. Oh, and definitely set up alerts for major changes. Nobody has time to babysit charts all day.
Honestly, quarterly is the bare minimum but monthly is way better if you're in something fast-moving. Wait for those earnings reports - that's when the real numbers drop. I'd set up alerts for when your main competitors release stuff because tracking dates manually sucks. Tech and crypto change so fast that monthly keeps you from falling behind. Time your updates right after competitors report their numbers. Oh and definitely set calendar reminders now - Q4 season sneaks up fast and you'll forget otherwise.
Honestly, comparative ratios are super helpful for cutting through company BS. You can pull P/E ratios and immediately see who's overvalued vs actually worth the hype. ROI tells you who's making smart moves with their money too. The cool thing is they normalize everything - doesn't matter if you're comparing a huge corp to a smaller player. I'd grab like 3-5 key ratios for your main competitors and track them quarterly. You'll start seeing patterns pretty quick. Way better than just listening to their earnings calls and trying to figure out what's real, you know?
So for competitor financial dashboards, Tableau and Power BI are your best bets - both handle financial data really well. Python's solid too if you're comfortable coding (Plotly, Dash). Excel can work but honestly gets super messy once you have tons of data. Data-wise, you'll need FactSet or Bloomberg for the financials, maybe some web scraping APIs. I'd just start with whatever tool your team already knows instead of learning something totally new. You can always add more fancy stuff later once you get the basics working.
First thing - normalize those non-financial metrics so they actually line up with your financial data. Convert satisfaction scores to percentages or whatever makes sense. Dual-axis charts are your friend here, plot revenue on one side and satisfaction trends on the other. Correlation matrices honestly blow my mind sometimes when you see how connected everything is. Look for patterns like customer satisfaction dips leading to revenue drops 2-3 quarters down the line. Set up alerts when non-financial metrics hit thresholds that historically meant trouble. The relationships become pretty obvious once you start tracking them together consistently.
Look, you really need that historical data as your baseline - I'm talking at least 3-5 years of quarterly stuff to make sense of competitor patterns. Past trends show you their revenue cycles and when they typically hit growth spurts or slumps. Your dashboard picks up on seasonal weirdness and flags when someone's acting way off their normal game. Without it? You're basically throwing darts blindfolded, which never ends well. Three years minimum gives you solid ground to stand on instead of just winging it with guesses.
So basically, these competitor dashboards show you where other companies are bleeding money or cutting corners. When you see them slashing R&D budgets or losing market share, that's your cue to jump in. Cash flow problems? Even better for you. It's wild how much you can learn just from their financial data. Plus you'll spot which market segments they're ignoring or pricing weird - happened to my buddy's startup last year, worked perfectly. Look for patterns where several competitors are tanking in the same area. That's where the real money is.
Honestly, you need to check your data against multiple sources - never trust just one vendor because their numbers can be all over the place. Set up alerts for weird spikes or drops that scream "something's broken." I do weekly spot-checks too, comparing key stuff to actual company filings. Sounds boring but it's way better than having your boss call you out in front of everyone (learned that one the hard way). Start checking weekly, then you can dial it back if everything stays stable.
Honestly, start by pulling sentiment scores from news headlines and matching them to stock moves or earnings dates. I'd focus on the big stuff - CEO changes, regulatory drama, product launches. The automated news feeds are clutch for catching breaking stories in real-time. Just don't get buried in meaningless noise though. What actually works is tracking news that correlates with real price movements or earnings surprises. Oh, and set up competitor alerts too - you'll want context when their numbers suddenly tank or spike. High/medium/low impact ratings help you prioritize what's actually worth your attention.
Data quality will bite you every time - garbage in, garbage out. Make sure you're pulling from solid sources and comparing similar companies, not mixing B2B with retail or whatever. Honestly, most people go overboard with metrics and create a hot mess. Pick 4-6 that actually matter for what you're trying to figure out. Don't just show snapshots either - trends over time tell the real story. I learned this the hard way when my first dashboard looked like a Christmas tree. Build simple first, then add more based on what people actually click on.
So basically you get this visual timeline showing revenue, profit margins, debt, cash flow - all that stuff. Makes it super easy to spot when competitors are tanking (acquisition time!) or getting stronger. Charts and graphs update automatically, which honestly beats manually digging through boring quarterly reports any day. The best part? You can set alerts for big changes. No more getting blindsided when some competitor suddenly starts bleeding money or posts crazy growth numbers. It's like having a early warning system for your industry.
Look, stakeholder feedback is literally everything when building these dashboards. Your sales folks want fast revenue comparisons, executives care about market share trends, finance needs margin breakdowns - totally different needs. I've watched so many projects crash because people just assumed what others wanted instead of actually asking first. The feedback tells you update frequency, alert settings, even what colors work for people. Oh and definitely interview each group about their specific pain points before you start building anything. Saves you from rebuilding the whole thing later, trust me.
So this dashboard basically lets you peek at your competitors' profit margins and revenue trends in real-time. Pretty cool stuff. When you see their margins dropping, that's your cue to get more aggressive with pricing. Revenue spiking in某个 segment? Check if they're undercutting you there. Honestly beats spending weeks digging through reports manually like we used to. You can also tell when they're panic-cutting prices versus making smart strategic moves. The key is updating your prices monthly instead of those boring quarterly reviews - way more responsive.
-
Use of different colors is good. It's simple and attractive.
-
Presentation Design is very nice, good work with the content as well.
-
Designs have enough space to add content.
-
Much better than the original! Thanks for the quick turnaround.
-
Unique research projects to present in meeting.