


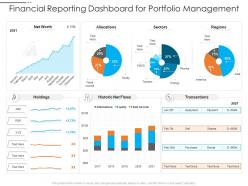
Financial reporting dashboard for portfolio management


Try Before you Buy Download Free Sample Product
 Impress Your
 Audience
Editable
of Time


Our Financial Reporting Dashboard For Portfolio Management are topically designed to provide an attractive backdrop to any subject. Use them to look like a presentation pro.
People who downloaded this PowerPoint presentation also viewed the following :
Financial reporting dashboard for portfolio management with all 2 slides:
Use our Financial Reporting Dashboard For Portfolio Management to effectively help you save your valuable time. They are readymade to fit into any presentation structure.
FAQs for Financial reporting dashboard
Honestly, just start with the big four: cash flow, revenue trends, profit margins, and accounts receivable aging. Burn rate too if you're watching monthly expenses - that metric has literally saved my ass so many times. Budget vs actual variance is huge. Also grab whatever KPIs matter for your specific industry. Charts make everything way easier to digest than boring spreadsheet rows. Set it up so everything updates automatically because manually refreshing data is the worst. You can always layer on more metrics later, but these core ones will cover like 90% of the decisions you'll actually need to make.
So you know how annoying it is waiting for reports to update? Real-time integration fixes that - you'll see stuff happening as it actually happens instead of finding out about problems weeks later. Your cash flow issues, budget problems, whatever - they pop up immediately instead of during those painful month-end meetings. Plus way fewer errors since people aren't manually typing numbers wrong all the time (we've all been there). Honestly though, don't go crazy trying to make everything live at once. Pick your most important metrics first and build from there.
Line charts are your best friend for showing trends over time - everyone knows how to read them. Bar charts work really well when you're comparing different periods or categories. Heat maps are actually pretty cool for showing performance across multiple departments at once, though I don't see them used enough. Just please avoid pie charts for financial stuff - they make everything harder to compare and honestly look kind of amateur. Oh, and keep your colors consistent throughout. Clear axis labels too. Start there and you'll have something people can actually understand instead of just pretty colors that don't tell you anything useful.
So basically each industry tracks totally different stuff on their dashboards. Healthcare companies care about patient revenue cycles and compliance costs. Retail? They're obsessed with inventory turnover and same-store sales. Manufacturing focuses on cost per unit and supply chain metrics - makes sense. SaaS is a whole different beast though - they live for MRR, churn rates, and customer acquisition costs. Honestly, generic P&L stuff doesn't tell you much. You've got to figure out what actually drives performance in your specific industry and put those metrics front and center on your dashboard.
Honestly, accessibility can make or break your financial dashboard. I've watched executives struggle with gorgeous dashboards because the fonts were tiny or they couldn't tell red from green. Screen readers need to work properly. Keyboard navigation matters more than you'd think. Color contrast is huge - especially for visually impaired users. The thing is, when you design for accessibility, it just works better for everyone anyway. Grab some accessibility tools and test what you've got, or better yet, find a few users with different needs to actually try it out.
Honestly, predictive analytics is a game-changer for financial forecasting. You're basically using historical data to predict what's coming instead of just staring at last quarter's numbers. The algorithms catch seasonal patterns and trends you'd probably miss - plus they update automatically when new data rolls in. I'd start small though, maybe just track monthly revenue first. Once you see how accurate it gets (and it's pretty crazy how well it works), then expand to cash flow and expenses. Way better than guessing, and your dashboard actually becomes useful for planning ahead instead of just reporting what already happened.
Don't cram everything onto one screen - it's just overwhelming. Test with real users first, trust me on this one. Rainbow pie charts might look fun but they're actually terrible (seen way too many of these). Focus on metrics that help people make actual decisions, not just whatever data is easiest to grab. Vanity metrics are useless if they don't lead to action. Start simple with your most critical KPIs. You can always layer on more complexity once the basics are solid and working well.
Honestly, dashboards are a lifesaver for compliance stuff. Real-time monitoring catches issues with liquidity ratios, capital requirements, all that SOX nonsense before they become problems. No more scrambling at month-end because you'll get alerts the second something's wonky. Instead of pulling data from like five different systems (which is the worst), you can generate those boring standardized reports regulators want with a couple clicks. Everything stays in one spot too. Trust me, set this up now and you'll actually sleep during audit season instead of living on coffee and panic.
Dude, mobile optimization is seriously clutch for finance stuff. You can check your KPIs while stuck in some boring meeting or when you're traveling. The touch interface makes drilling into metrics super easy too. What I love most? Push notifications that hit you up when something's going wrong - budget overruns, missed targets, whatever. Honestly saved my butt more times than I can count. Set up alerts for your biggest metrics so you don't get blindsided by financial disasters. Being able to approve budgets from anywhere is pretty sweet too.
Honestly, I'd start with Power BI or Tableau - both are pretty solid for pulling in financial data and making decent interactive reports. Excel's actually not terrible if you're working with smaller stuff and your team already knows it (which they probably do). Qlik Sense is worth looking at too, though it's kind of a pain to learn at first. For more complex financial modeling, maybe check out Adaptive Insights or Anaplan. But seriously, just pick whatever plays nice with your current accounting software. Trust me on this one - you don't want to deal with integration nightmares later.
Monthly updates are the bare minimum, but weekly is way better if you can manage it. Cash flow and revenue especially - those need fresh data or you'll just ignore the whole thing. I've watched so many dashboards turn into expensive screensavers because nobody bothered updating them. Daily stuff like sales? Just automate that so you're not stuck doing manual work all the time. Honestly, start monthly and then bump up the frequency for whatever metrics actually matter to your business. Don't overthink it - stale data is worse than no dashboard at all.
Honestly, just sprinkle feedback opportunities everywhere users naturally pause. Pop-up surveys work great after someone exports a report - "Was this helpful?" Quick and easy. But here's the thing - watching actual people use your dashboard beats any survey data. Seriously, you'll cringe watching them hunt for basic stuff. Get your power users in a room monthly for feedback sessions. Oh, and throw a simple feedback widget somewhere so people can complain without jumping through hoops. Pick one small suggestion each month and actually fix it. Then tell people what you changed - they eat that stuff up.
Know your audience first - that's everything. Executives want maybe 5-7 big numbers they can scan in under 30 seconds. Revenue, margins, cash flow - the stuff that actually drives decisions. Then add drill-down options for the finance nerds who live for granular details. I made this mistake once and built something that looked like mission control, honestly. Total disaster. Your best bet? Test it with real users and just watch them. If they're scrolling past whole sections or seem confused, you've missed the mark. Build it piece by piece based on their feedback - saves you tons of headaches later.
Build validation checks straight into your dashboard workflow - automated data reconciliation between sources plus real-time alerts when stuff doesn't add up. You'll want clear data governance too, with specific owners for each metric. Trust me, nothing screws up accuracy faster than everyone thinking someone else is handling it! Set up version control so you can track changes and roll back when needed. Create multiple checkpoints: source validation, transformation checks, final output verification. Oh, and start with your most critical KPIs first. Then expand the validation rules from there once you've got those locked down.
Honestly, dashboards are game-changers for this stuff. You get real-time visibility into cash flow, debt ratios, profit margins - all the metrics that actually matter. Way better than staring at endless spreadsheet rows (been there, done that, went slightly insane). Set up alerts so you're not manually checking everything constantly - like when revenue dips or expenses spike. The visual format helps you catch patterns you'd totally miss otherwise. Plus you can track which products or regions are crushing it and spot growth opportunities. Just don't go overboard with too many metrics or you'll get overwhelmed.
-
Awesomely designed templates, Easy to understand.
-
Attractive design and informative presentation.
-
Use of icon with content is very relateable, informative and appealing.
-
Excellent design and quick turnaround.