

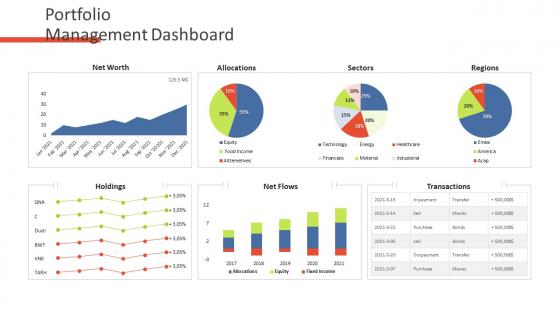
Financial assets analysis portfolio management dashboard




Try Before you Buy Download Free Sample Product
 Impress Your
 Audience
 100%
100% Editable
 Save Hours
 of Time


Our Financial Assets Analysis Portfolio Management Dashboard are topically designed to provide an attractive backdrop to any subject. Use them to look like a presentation pro.
People who downloaded this PowerPoint presentation also viewed the following :
Financial assets analysis portfolio management dashboard with all 2 slides:
Use our Financial Assets Analysis Portfolio Management Dashboard to effectively help you save your valuable time. They are readymade to fit into any presentation structure.
FAQs for Financial assets analysis
You'll want to track your ROI first - that's the obvious one. But also check volatility and the Sharpe ratio for risk-adjusted returns. Don't ignore how your stuff correlates with the broader market either. Drawdown periods matter too (how much you lose when things go south). Oh, and liquidity - can you actually get out when you need to? Honestly, people stress way too much about daily moves. Focus on longer trends instead. Pull at least 3-5 years of data if you can, and always compare against benchmarks so you're not just guessing.
So basically when rates go up, your bonds tank and stocks usually follow since future earnings get discounted more heavily. GDP growth is pretty straightforward - economy does well, corporate profits look better, stock prices rise. Inflation's weird though because it can mean things are heating up economically but it also eats away at your actual returns. Don't forget about currency moves if you've got international stuff. Honestly the tricky part isn't understanding each factor - it's seeing how they all mesh together when you're actually putting together your portfolio.
Look, diversification is just not putting all your money in one thing - spread it around different types of investments so if one crashes, you're not screwed. Yeah, you might miss out on some crazy gains, but you'll sleep better at night. Honestly, boring beats broke every time. Mix it up across maybe 3-4 different asset types. Don't put more than 5-10% in any single stock or whatever. I learned this the hard way back in college when I went all-in on one tech stock... anyway, it's about finding what works for your situation and how much risk makes you sweat.
Check volatility first - basically how crazy the price swings get. Beta's useful too, shows how it moves vs the overall market. For bonds, definitely look at credit ratings. Diversification honestly saves your ass more than anything else. Can't predict when stuff goes south. Also make sure you can actually sell the thing quickly if needed - some assets are a pain to dump. I always compare similar investments and their risk-return ratios. Sounds boring but it works. The real trick is figuring out your worst-case scenario, not just dreaming about gains.
Stocks mean you actually own part of a company - like a tiny slice. When they do well, you make money. When they don't, well... you lose it. Bonds are basically you loaning money to companies or the government, and they pay you back with interest. Way more boring but safer. There's other stuff like options and ETFs, but honestly? I'd figure out stocks and bonds first. The derivatives world gets pretty weird pretty fast, and you don't need that headache when you're starting out. Master the basics, then maybe branch out later.
So basically rates and bond prices are enemies - one goes up, the other tanks. Your bond paying 3% becomes worthless if new ones are suddenly offering 5%, right? You'd have to sell yours cheap because who wants the worse deal. Long-term bonds get hit way harder than short ones too. Honestly, I'd watch what the Fed's doing and maybe spread your bond dates around (laddering I think it's called?). Takes some of the sting out when rates jump around like they've been doing lately.
So there's three main ones you'll see everywhere: DCF, comps, and precedent transactions. DCF is where you project future cash flows and discount them back - it's kind of the bread and butter method. Comps looks at similar companies trading right now (great for quick reality checks). Then precedent transactions examines recent M&A deals. Asset-based stuff comes up sometimes too, depending on the situation. Honestly, nobody just picks one and calls it done. Most people I know use all of them to get a valuation range - like DCF as your base, then the others to make sure you're not totally off. Start there and you'll be fine.
So basically, investor emotions move prices way more than actual company value - at least short-term. Everyone gets hyped? Prices shoot up past what makes sense (hello GameStop lol). Fear kicks in and suddenly solid companies are trading like garbage. Honestly, it's wild how disconnected price can get from reality during these swings. You'll see total trash pump during bull runs while great businesses crater when people panic. The trick is spotting when sentiment has completely taken over. That's where the real money is - buying fear, selling greed, all that classic stuff.
Regulations can totally mess with your asset values - sometimes literally overnight. IFRS 9 was a perfect example, completely changed how we deal with credit losses. Your capital ratios shift, asset classifications get weird, and suddenly stuff that was profitable becomes dead weight on your books. Risk assessments change too, plus liquidity rules and what you can even hold in different portfolios. Honestly, the whole thing cascades through everything. I always tell people to run scenarios when you hear regulatory changes coming down the pipeline - learned that one the hard way. Don't get caught scrambling to revalue everything at the last minute.
So basically, technical analysis is all about studying charts and price patterns to figure out where stocks might go next. You're looking at historical data, volume, stuff like moving averages and RSI indicators. Honestly, it feels like reading tea leaves half the time, but the patterns actually do show up again and again. It's totally different from fundamental analysis - you're not digging into company earnings or anything like that. Just pure price action and how people are feeling about the market. My advice? Start simple with basic chart patterns and maybe 2-3 indicators max. Don't go crazy with every tool out there.
So liquidity is just how fast you can buy or sell something without screwing up the price. Apple stock? Gone in seconds. Your house? Yeah, that's gonna take a while lol. When stuff's more liquid, you get tighter bid-ask spreads and way less price impact when you trade. Transaction costs drop too. I'd say focus on liquid assets if you need that flexibility to move money around quickly. But honestly, don't sleep on illiquid investments - they often pay better returns if you can handle waiting it out.
Honestly, when big geopolitical stuff happens, markets just freak out. Gold and bonds usually do well because everyone's running scared from riskier stuff. Stocks? They tank at first. Currencies get all over the place too, especially if it involves major economies. Here's the thing though - markets overreact like crazy in those first few days. Then reality sets in and things start making sense again. I learned this the hard way in 2020. Don't go moving your portfolio around when everything's chaotic. Wait it out until you can actually see what the real economic damage is gonna be.
Honestly, Bloomberg Terminal is still king if you can afford it - but it's stupid expensive. Excel's gonna be your best friend for most modeling stuff, I don't care what anyone says. TradingView's pretty solid for charts and market data, or just use Yahoo Finance if you're being cheap about it. Python's kinda becoming mandatory now if you're doing real quantitative work - pandas and numpy are the main libraries you'll need. R works too for stats. Oh and Morningstar Direct's great for portfolio stuff. Start with whatever you can actually get your hands on though - even Google Finance has decent fundamentals data.
Historical data's your best friend here - dig into price movements, volatility patterns, and how your picks handled different market chaos. Seasonal trends are huge too. I usually pull 5-10 years of data to build any decent forecast model. Short timeframes are pretty much useless though. Mix in volume data and economic indicators alongside the price stuff. Look for patterns that keep showing up, but honestly don't get too cocky about it - markets love proving everyone wrong. The correlation stuff between sectors can be gold if you spot it early enough.
Look, the biggest thing is staying objective - don't let your own investments mess with what you're telling people. Be upfront about gaps in your data too. ESG stuff actually matters now for risk assessment, not just PR fluff. Also worth thinking about whether you're pushing assets that could screw over communities or trash the environment (probably sounds preachy but whatever). Short version: be honest about uncertainty levels and potential downsides. Your coworkers need the real deal to make decent decisions, not sugar-coated BS.
-
Informative presentations that are easily editable.