


Investment Portfolio Management PowerPoint Presentation Slides




Try Before you Buy Download Free Sample Product
 Impress Your
 Audience
 100%
100% Editable
 Save Hours
 of Time


Our Investment Portfolio Management PowerPoint Presentation Slides are topically designed to provide an attractive backdrop to any subject. Use them to look like a presentation pro.
People who downloaded this PowerPoint presentation also viewed the following :
Content of this Powerpoint Presentation
Slide 1: This slide introduces Investment Portfolio Management. State Your Company Name and begin.
Slide 2: This is an Agenda slide. State your agendas here.
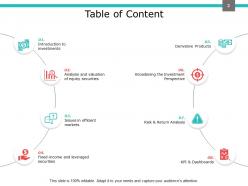
Slide 3: This slide shows Table of Content for the presentation.
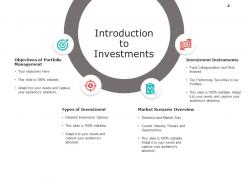
Slide 4: This slide presents Introduction to Investments describing- Objectives of Portfolio Management, Investment Instruments, Types of Investment, Market Scenario Overview.
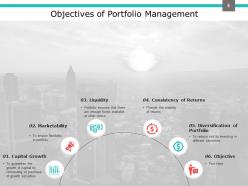
Slide 5: This slide displays Objectives of Portfolio Management describing- Capital Growth, Marketability, Liquidity, Consistency of Returns, Diversification of Portfolio, Objective.
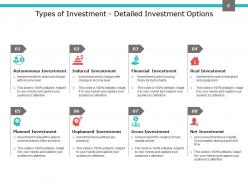
Slide 6: This slide represents Types of Investment - Detailed Investment Options describing- Autonomous Investment, Induced Investment, Financial Investment, Real Investment, Planned Investment, Unplanned Investment, Gross Investment, Net Investment.
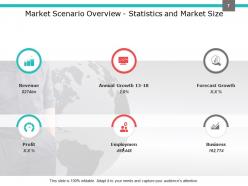
Slide 7: This slide showcases Market Scenario Overview - Statistics and Market Size describing- Revenue, Annual Growth 13-18, Forecast Growth, Profit, Employment, Business.
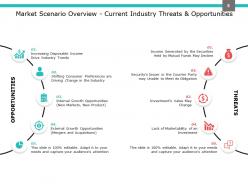
Slide 8: This slide shows Market Scenario Overview - Current Industry Threats & Opportunities with related text to elaborate.
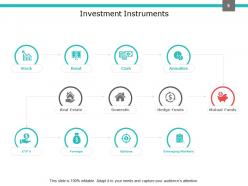
Slide 9: This slide presents Investment Instruments which includes- Stock, Annuities, Bond, Cash, Real Estate, Mutual Funds, Domestic, Hedge Funds, ETF’s, Emerging Markets, Foreign Options.
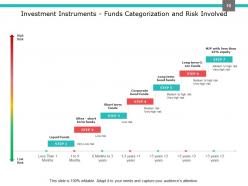
Slide 10: This slide displays Investment Instruments - Funds Categorization and Risk Involved as- Liquid funds, Ultra - short term funds, Short term funds, Corporate bond funds, Long term bond funds, Long term G-sec funds, MIP with less than 25% equity.
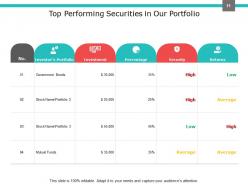
Slide 11: This slide represents Top Performing Securities in Our Portfolio with categories as- Investor’s Portfolio, Investment, Percentage, Security, Returns.
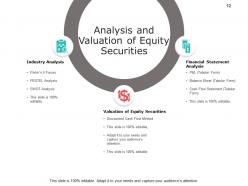
Slide 12: This slide showcases Analysis and Valuation of Equity Securities describing- Industry Analysis, Financial Statement Analysis, Valuation of Equity Securities.
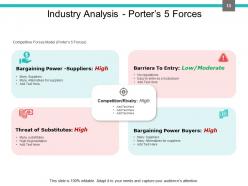
Slide 13: This slide shows Industry Analysis - Porter’s 5 Forces as- Competition/Rivalry, Bargaining Power -Suppliers, Barriers To Entry, Threat of Substitutes, Bargaining Power Buyers.
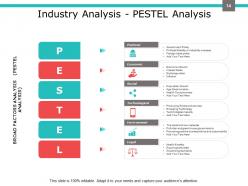
Slide 14: This slide presents Industry Analysis - PESTEL Analysis which include Political, Economic, Social, Technological, Environment and Legal analysis.
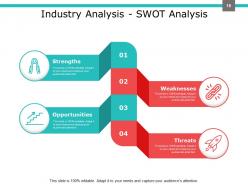
Slide 15: This slide displays Industry Analysis - SWOT Analysis as- Strengths, Weaknesses, Opportunities and Threats analysis.
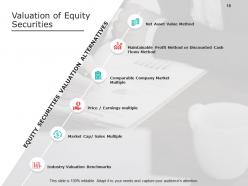
Slide 16: This slide represents Valuation of Equity Securities describing- Net Asset Value Method, Maintainable Profit Method or Discounted Cash Flows Method, Comparable Company Market Multiple, Price / Earnings multiple, Market Cap/ Sales Multiple, Industry Valuation Benchmarks.
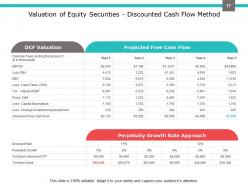
Slide 17: This slide showcases Valuation of Equity Securities - Discounted Cash Flow Method describing- DCF Valuation, Projected Free Cash Flow, Perpetuity Growth Rate Approach.
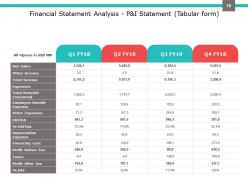
Slide 18: This slide shows Financial Statement Analysis - P&I Statement in Tabular form with net sales, total income, total expenses, profit before and after tax etc.
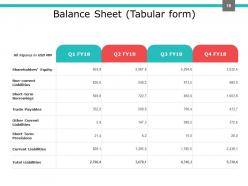
Slide 19: This slide presents Balance Sheet in Tabular form with total liabilities.
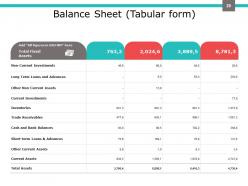
Slide 20: This slide presents Balance Sheet in Tabular form with total assets.
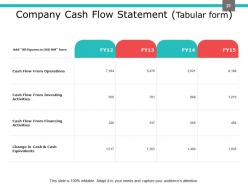
Slide 21: This slide displays Company Cash Flow Statement in Tabular form describing- Cash flow from operations, cash flow from investing activities, cash flow from financing activities, change in cash and cash equivalents etc.
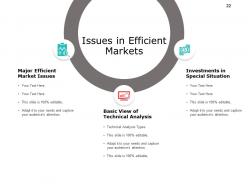
Slide 22: This slide represents Issues in Efficient Markets describing- Major Efficient Market Issues, Investments in Special Situation, Basic View of Technical Analysis.
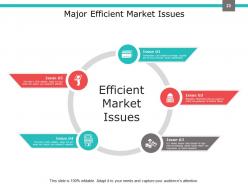
Slide 23: This slide showcases Major Efficient Market Issues as- Transactions Cost related to exchange of goods and services overcome market imperfections, Regulatory Restrictions that are subject to control and guidelines for efficient market etc.
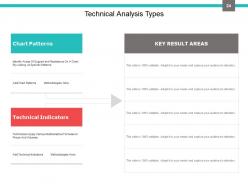
Slide 24: This slide shows Technical Analysis Types with chart patterns, technical indicators and key result areas.
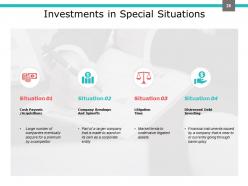
Slide 25: This slide presents Investments in Special Situations with icons and text boxes to show information.
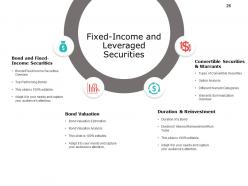
Slide 26: This slide displays Fixed-Income and Leveraged Securities describing- Bond and Fixed-Income Securities, Convertible Securities & Warrants, Duration & Reinvestment, Bond Valuation.
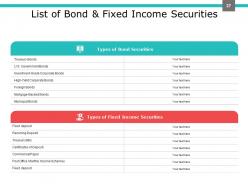
Slide 27: This slide represents List of Bond & Fixed Income Securities in a tabular form with related text.
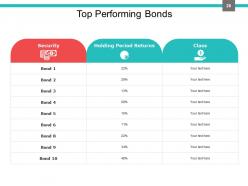
Slide 28: This slide showcases Top Performing Bonds with categories as- Security, Holding Period Returns, Class.
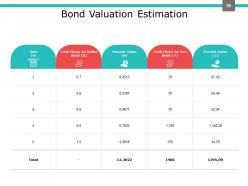
Slide 29: This slide shows Bond Valuation Estimation with categories as- Time, Cash Flows on Dollar Bond, Present Value, Cash Flows on Yen Bond, Present Value.
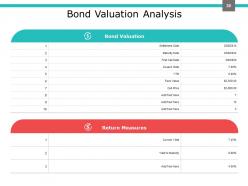
Slide 30: This slide presents Bond Valuation Analysis describing- Bond Valuation and Return Measures.
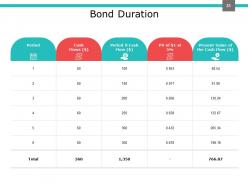
Slide 31: This slide displays Bond Duration with categories as- Period Cash Flows ($) Period X Cash Flow ($) PV of $1 at 5% Present Value of the Cash Flow ($)
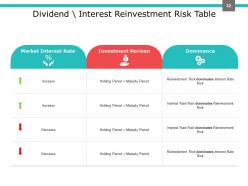
Slide 32: This slide represents Dividend \ Interest Reinvestment Risk Table with categories as- Market Interest Rate, Investment Horizon, Dominance.
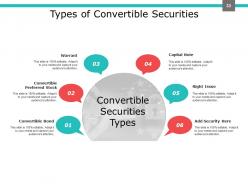
Slide 33: This slide showcases Types of Convertible Securities describing- Convertible Bond, Convertible Preferred Stock, Warrant, Capital Note, Right Issue.
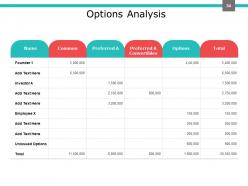
Slide 34: This slide shows Options Analysis in tabular form with related text.
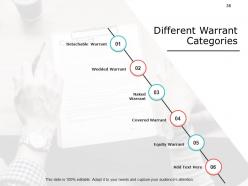
Slide 35: This slide presents Different Warrant Categories as- Detachable Warrant, Wedded Warrant, Naked Warrant, Covered Warrant, Equity Warrant etc.
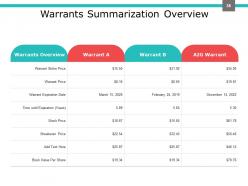
Slide 36: This slide displays Warrants Summarization Overview with warrant price, warrant expiration date, stock price etc.
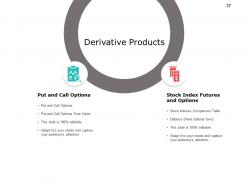
Slide 37: This slide represents Derivative Products such as- Put and Call Options and Stock Index Futures and Options.
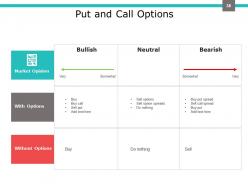
Slide 38: This slide showcases Put and Call Options with categories as Bullish, Neutral, Bearish.
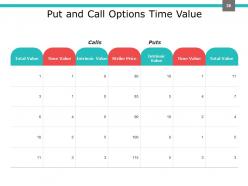
Slide 39: This slide shows Put and Call Options Time Value in tabular form with categories as- Total Value, Time Value, Intrinsic Value, Strike Price, Intrinsic Value, Time Value, Total Value.
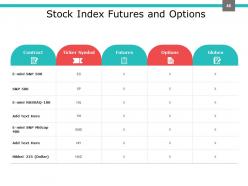
Slide 40: This slide presents Stock Index Futures and Options with categories as- Contract, Ticker Symbol, Futures, Options, Globex.
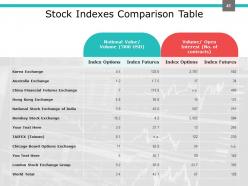
Slide 41: This slide displays Stock Indexes Comparison Table comparing exchanges such as- Korea exchange, Australia exchange, Hong kong stock exchange, bombay stock exchange etc.
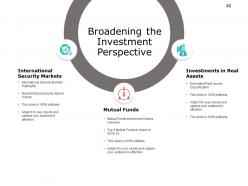
Slide 42: This slide represents Broadening the Investment Perspective describing- International Security Markets, Investments in Real Assets, Mutual Funds.
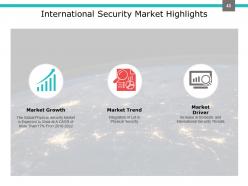
Slide 43: This slide showcases International Security Market Highlights describing- Market Growth, Market Trend, Market Driver.
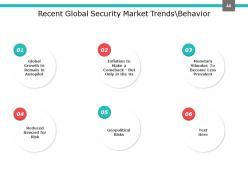
Slide 44: This slide shows Recent Global Security Market Trends\Behavior describing- Inflation to Make a Comeback - But Only in the Us, Global Growth to Remain in Autopilot, Monetary Stimulus To Become Less Prevalent, Reduced Reward for Risk, Geopolitical Risks etc.
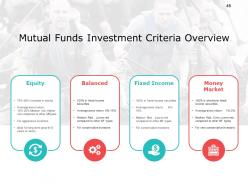
Slide 45: This slide presents Mutual Funds Investment Criteria Overview with parameters as- Equity, Balanced, Fixed Income, Money Market.
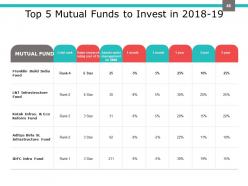
Slide 46: This slide displays Top 5 Mutual Funds to Invest in 2018-19 witch categories as- MUTUAL FUND, Crisil rank, Value research rating, Assets under management etc.
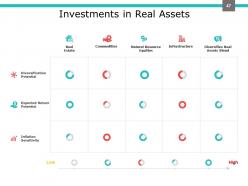
Slide 47: This slide represents Investments in Real Assets such as- Real Estate, Commodities, Natural Resource Equities, Infrastructure, Diversifies Real Assets Blend.
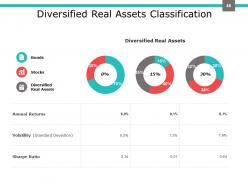
Slide 48: This slide showcases Diversified Real Assets Classification describing- annual returns, Volatility, Shape ratio etc.
Slide 49: This slide shows Risk & Return Analysis in a tabular form with text boxes to show information.
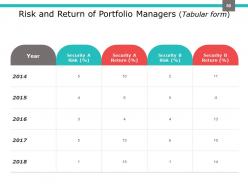
Slide 50: This slide presents Risk and Return of Portfolio Managers in Tabular form with years, security risk, security return etc.
Slide 51: This slide displays KPI & Dashboard describing- KPI Dashboard and KPI Metrics.
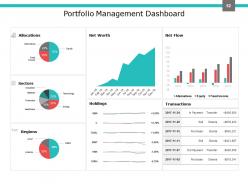
Slide 52: This slide represents Portfolio Management Dashboard with- Allocations, Sectors, Regions, Net Worth, Holdings, Net Flow, Transactions.
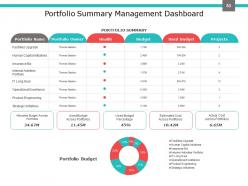
Slide 53: This slide showcases Portfolio Summary Management Dashboard with- Portfolio Name, Portfolio Owner, Health, Budget, Used Budget, Projects.
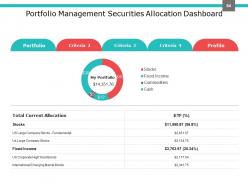
Slide 54: This slide shows Portfolio Management Securities Allocation Dashboard with Portfolio, Criterias, Profile etc.
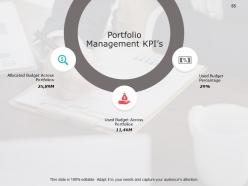
Slide 55: This slide presents Portfolio Management KPI’s describing- Allocated Budget Across Portfolios, Used Budget Percentage, Used Budget Across Portfolios.
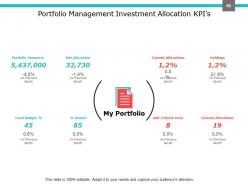
Slide 56: This slide displays Portfolio Management Investment Allocation KPI’s Portfolio Summary Net Allocation Used Budget percentage, Current allocations etc.
Slide 57: This slide shows Investment Portfolio Analysis Icons.
Slide 58: This slide reminds about a Coffee Break.
Slide 59: This slide is titled as Additional Slides for moving forward.
Slide 60: This is Meet Our Team slide with names and designation.
Slide 61: This is Our Mission slide with imagery and text boxes.
Slide 62: This is About Us slide to show company specifications etc.
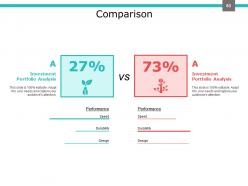
Slide 63: This is a Comparison slide to state comparison between commodities, entities etc.
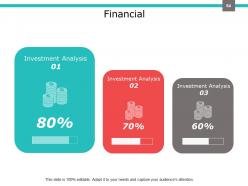
Slide 64: This is a Financial slide. Show your finance related stuff here.
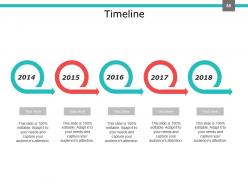
Slide 65: This is a Timeline slide. Show information related with time period here.
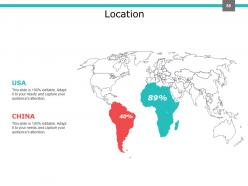
Slide 66: This is a Location slide with maps to show data related with different locations.
Slide 67: This is a Puzzle slide with text boxes to show information.
Slide 68: This is a Target slide. Show your targets here.
Slide 69: This is a Venn slide with additional text boxes to show information.
Slide 70: This is a Thank you slide for acknowledgement.
Investment Portfolio Management PowerPoint Presentation Slides with all 70 slides:
Use our Investment Portfolio Management PowerPoint Presentation Slides to effectively help you save your valuable time. They are readymade to fit into any presentation structure.







FAQs for Investment Portfolio Management
So you'll want to figure out your stock/bond mix first - depends on when you need the cash and how much market swings freak you out. Diversify across different sectors and countries, not just the usual suspects. I made the mistake of going heavy on tech once... yeah, that sucked. Write down your target percentages and actually stick to them when everything goes sideways. Oh, and don't forget about fees eating into your returns. Rebalancing is key too - maybe quarterly or when things get really out of whack. Risk tolerance sounds boring but it's honestly the most important thing to nail down.
So basically you spread your money around different types of investments so they don't all crash together. Stocks, bonds, maybe some international stuff, REITs if you're into that. When one thing goes down, hopefully something else stays steady or goes up. The trick is picking things that actually move differently - like don't buy 10 tech stocks and call it diversified lol. I learned this the hard way in 2020. Different assets react to market drama in different ways, so you're not totally screwed when things get weird. It really does smooth out the ups and downs over time.
So asset allocation is just how you divide up your money between different types of investments - stocks, bonds, whatever else. Young and saving for retirement? Load up on stocks since you've got time to ride out the ups and downs. But if you need cash in like 5 years, bonds are your friend for stability. It's honestly more like cooking - getting the right mix matters way more than obsessing over individual picks. Don't just copy what your coworker's doing though. Your timeline and how much risk makes you sweat at night? That's what should drive your decisions.
Check your portfolio every quarter and rebalance when something's off by 5-10% from your target. Don't stress about tiny changes though - that's just normal market stuff. Honestly, the laziest way is just putting new money into whatever's lagging behind instead of selling anything. If you do need to sell, do it in your 401k or IRA first so you won't get hit with taxes. I learned that one the hard way lol. Just pick whatever schedule works and stick with it rather than trying to be all strategic about timing.
Dude, your brain is basically working against you when investing. You'll hold onto losing stocks forever because selling feels like admitting you screwed up - that's loss aversion. Then there's confirmation bias where you only read stuff that makes your picks look smart. Overconfidence? That leads to way too much trading and terrible timing. Don't even get me started on following whatever everyone else is doing instead of your own plan. Fear and greed mess up everything, honestly. My advice? Write down your rules when you're thinking clearly, then actually follow them when the market goes crazy.
Market swings will mess with your portfolio - that's just how it works. Growth stocks kill it when things are good, but you'll want safer stuff like bonds when everything tanks. Honestly, the hardest part is not jumping on every hot trend (learned that one the hard way). Focus on what actually affects your stocks instead. Rebalancing quarterly makes sense, though I sometimes get lazy and stretch it longer. Stay flexible with your mix but don't freak out every time some crazy headline drops. That's where people really screw themselves over.
So beyond just looking at total returns, you'll want to check your Sharpe ratio - basically how much return you're getting per unit of risk. Alpha shows if you're actually beating your benchmark. Beta measures how volatile you are compared to the market. Max drawdown is huge though - clients freak out way more about potential losses than they care about fancy metrics, trust me. Keep an eye on expense ratios too since fees slowly kill your returns. Don't just compare everything to the S&P 500 either. Set up a monthly dashboard to track this stuff so you can catch problems before they get ugly.
There's a few ways to work ESG into your investing. You can screen out stuff you don't like - tobacco, oil, whatever. Or actively pick companies with solid ESG scores. Dedicated ESG funds are another route. Most platforms show ESG data now alongside the usual financial stuff, which is pretty helpful. Don't make it your only criteria though - I've seen people do that and it really limits your choices. Figure out what ESG issues you actually care about first, then hunt for funds or stocks that score well there. It's about finding that sweet spot between your values and decent returns.
So with active management, you're basically paying some fund manager 1-2% annually to try beating the market through stock picking. Most don't actually pull it off though. Index funds are way cheaper - like under 0.1% - and just match whatever the market does. You won't get those crazy high returns, but you also won't get burned by some manager making terrible calls. Honestly depends if you want to gamble on outperformance or just ride the market's average gains without the hefty fees eating into everything.
Dude, time horizon changes everything about how you should invest. Got 30+ years? Load up on growth stocks - those market dips are just noise at that point. Need the cash in 2-3 years though? Stick with bonds and safer stuff. I'm still kicking myself over 2008 when I had to sell during the crash because I didn't plan this out right. Honestly, most people don't even think about when they'll actually need their money. Map out those dates first, then figure out how aggressive you can be with each chunk.
Look into Charles River, Bloomberg AIM, or Eze Eclipse - they'll automate your rebalancing and risk stuff. Total game changers but yeah, learning curve's rough at first. For data feeds, Refinitiv or FactSet are solid for real-time pricing. Aladdin's pretty cool since it does portfolio construction AND risk management together. Oh, and API integrations connect everything smoothly. My advice? Figure out what's driving you crazy first - manual rebalancing, messy reports, whatever. Then grab tools that actually fix those specific headaches instead of going overboard with features you won't use.
Honestly, I'd start spreading stuff around now while things are chill - mix of stocks, bonds, maybe some REITs. Cash is super underrated too; having like 6-12 months saved up is a lifesaver when everything goes sideways. Dividend stocks and solid bonds usually don't get hammered as hard during crashes. Oh, and don't do what everyone does and panic sell when things get crazy - that's how you actually lose money. My buddy did that in 2020 and still kicks himself. Get your defensive stuff set up before everyone else starts scrambling.
Taxes will absolutely wreck your returns if you don't think about them. Long-term capital gains get way better tax rates than short-term, and municipal bonds can be tax-free (depends on your state though). Honestly, this stuff sounds super dry but it makes a massive difference. You should look into tax-loss harvesting too - basically using losses to offset gains. Also matters which accounts you put things in. I learned this the hard way a few years back. Just pull up your current stuff and see if you're actually optimizing for what you keep, not just what you make on paper.
Honestly, get 3-6 months of expenses saved first before you even think about investing. That's non-negotiable. After that, it's all about timing - if you need the money in 2-3 years, stick with boring stuff like CDs or money market accounts. Trust me on this one, I got burned trying to time the market when I was saving for a house down payment. Terrible idea. For longer goals though? That's when you can mess around with stocks or real estate. Just map out when you'll actually need the cash and work backwards from there.
So the big things right now are ESG stuff (like environmental and social impact), AI helping pick investments, and this direct indexing thing that's getting popular. Personalized portfolios are huge too - people want investments that match their values and tax situations instead of generic funds. Oh and alternative investments are way easier to get into now with fractional ownership, which is pretty cool actually. Robo-advisors aren't just robots anymore either - they're mixing in human advice. You should probably check if your current platform does any of this newer stuff or if you need to switch things up.
-
Designs have enough space to add content.
-
Out of the box and creative design.
-
Content of slide is easy to understand and edit.
-
Wonderful templates design to use in business meetings.
-
Qualitative and comprehensive slides.