


Investment Funds Powerpoint Presentation Slides


Try Before you Buy Download Free Sample Product
 Impress Your
 Audience
Editable
of Time


Stocks, bonds, money market instruments, and other assets are the essence of investment funds and in our stellar Investment funds PowerPoint presentation slides. We have elaborated everything you need to know before investing for your inherent advantage. Processes included in these powerpoint slides covers detailed topics of investment funds, investment money, and investment finance. Flat designs and minimalistic approach are adapted here to give a clear understanding of the topic of concern. All the images can be personalized and are included for a more engaging experience. Magnanimous icons used here gives an open and apparent idea about the purpose of the presentation and highlight the prime concerns of the process. Keeping these facts in mind this PPT design has been created. A good command is a quality of a leader and this PPT Slide could be a treasure for those who seek for nothing else but perfection. Just download SlideTeam's investment ppt slides and grant your opinions and concepts as like never done before. Give every argument due attention with our Investment Funds Powerpoint Presentation Slides. They create that critical balance.
People who downloaded this PowerPoint presentation also viewed the following :
Content of this Powerpoint Presentation
Slide 1: This slide introduces Investment Funds. state Your Company Name and begin.
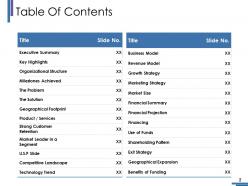
Slide 2: This slide showcases Table Of Contents with some of the sections we have listed. If you want to add more than you can.
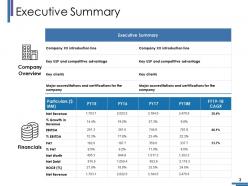
Slide 3: This slide presents Executive Summary. Add the financial and company overview as well.
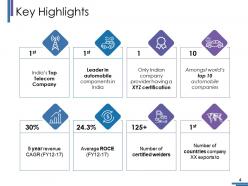
Slide 4: This slide presents Key Highlights. You can locate your highlights and make the use of it.
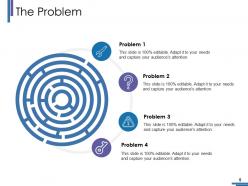
Slide 5: This slide showcases The Problem. You can add the problem statement and use as per requirement.
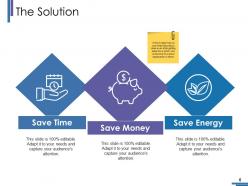
Slide 6: This slide shows The Solution. You can add these three categories and make use of it- Save Time, Save Money, Save Energy, If the investor has no clue what the product does even after getting deep into a pitch; now is the time for a short explanation or demo
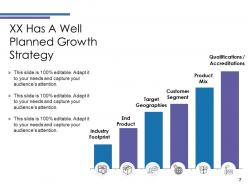
Slide 7: This slide showcases XX Has A Well Planned Growth Strategy with these six sections- Customer Segment, Product Mix, Qualifications, Accreditations, Industry Footprint, End Product, Target Geographies.
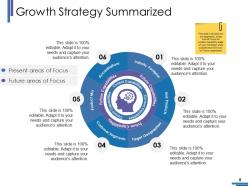
Slide 8: This slide shows Growth Strategy Summarized with these six categories- Accreditations, Product Mix, Target Geographies, End Products, Industry Footprint, Customer Segments, This slide is divided into two segments: inside one will focus on present capability areas of your company; while outside area will focus on Future capabilities
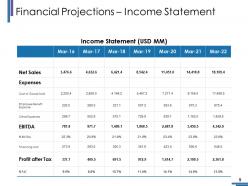
Slide 9: This slide presents Financial Projections – Income Statement table. Add the data and make use of it.
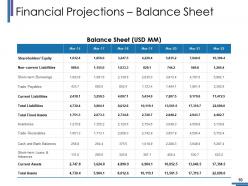
Slide 10: This slide showcases Financial Projections – Balance Sheet. Add the monthly information in the balance sheet.
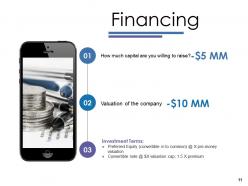
Slide 11: This slide presents Financing. Add your information as per your own use.
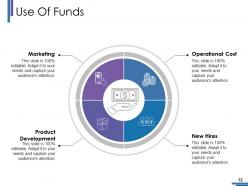
Slide 12: This slide showcases Use Of Funds with these four steps- Marketing, Product Development, Operational Cost, New Hires.
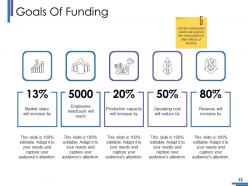
Slide 13: This slide presents Goals Of Funding with these five parameters- Market share will increase by, Employees headcount will reach, Production capacity will increase by, Operating cost will reduce by, Revenue will increase by, Add few data points which will support the implications of after-effects of funding
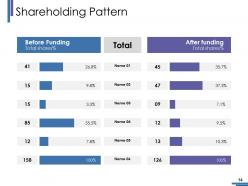
Slide 14: This slide showcases Shareholding Pattern. You can add the before funding and after one.
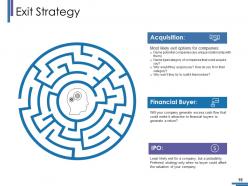
Slide 15: This slide presents Exit Strategy with these three factors- Acquisition, Financial Buyer, IPO.
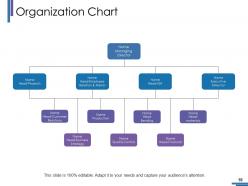
Slide 16: This slide showcases Organization Chart with these levels- Managing Director, Head-Projects, Head-Employee Relation & Admin, Head-QA, Executive Director, Head-Customer Relations, Production, Head Bending, Head-materials, Head-Business Strategy, Quality Control, Head-Financial.
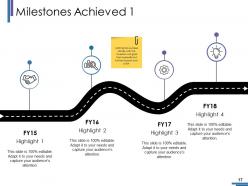
Slide 17: This slide presents Milestones Achieved 1 with the highligts you can write with financial year- Highlight 1 FY15, Highlight 2 FY16, Highlight 3 FY17, Highlight 4 FY18, Adding few success stories with the investors will grab their eyeballs and further support your pitch
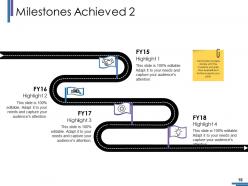
Slide 18: This slide presents Milestones Achieved 2. Adding few success stories with the investors will grab their eyeballs and further support your pitch
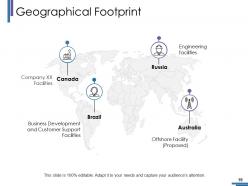
Slide 19: This slide showcases Geographical Footprint with these marked pointer- Canada, Russia, Australia, Brazil.
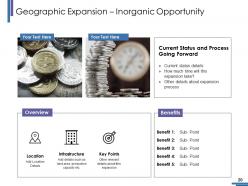
Slide 20: This slide showcases Geographic Expansion – Inorganic Opportunity. You can add your details and make the use of it.
Slide 21: This slide shows Emphasis Geographic & Product Expansion. Adding few success stories with the investors will grab their eyeballs and further support your pitch
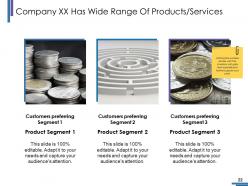
Slide 22: This slide presents Company XX Has Wide Range Of Products/Services. Adding few success stories with the investors will grab their eyeballs and further support your pitch
Slide 23: This slide shows Along With Superior Technical Capabilities. Add your capabilities and make use of it.
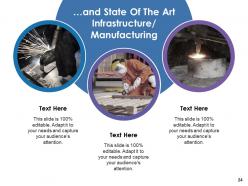
Slide 24: This slide showcase and State Of The Art Infrastructure/ Manufacturing.
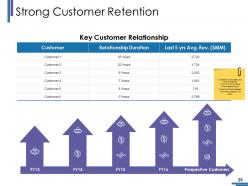
Slide 25: This slide presents Strong Customer Retention. Comments to be added about client experiences, relationship with particular client, special events
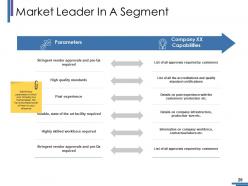
Slide 26: This slide showcases Market Leader In A Segment. Add the key parameters in which your company is a market leader. We have shortlisted some of them for your reference
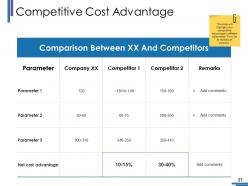
Slide 27: This slide presents Competitive Cost Advantage and also will highlight your competitive advantage in different parameters. Try to be as realistic as possible.
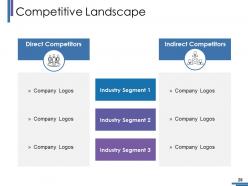
Slide 28: This slide showcases Competitive Landscape with the direct competitors and indirect. You can add the industry segment.
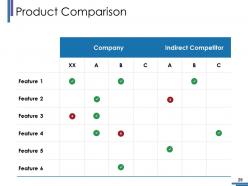
Slide 29: This slide presents Product Comparison. Add the information in the table.
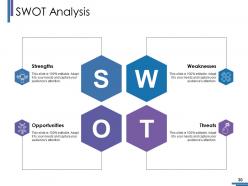
Slide 30: This slide showcases SWOT Analysis with these four stages- Weaknesses, Threats, Strengths, Opportunities.
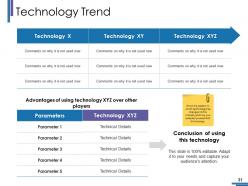
Slide 31: This slide presents Technology Trend. Show the pattern in which technology has changed in this industry and how you adapted yourself with this change.
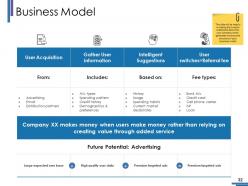
Slide 32: This slide shows Business Model and it also includes in making the investor understand about how your company works, generates revenue and structure of your business model.
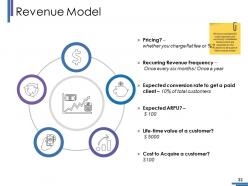
Slide 33: This slide presents Revenue Model. We have considered 6 most important and commonly considered factors which are expected by the investors to be a part of their revenue model.
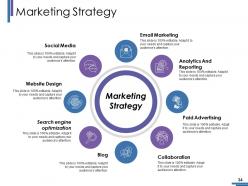
Slide 34: This slide showcases Marketing Strategy with these eight points- Social Media, Website Design, Search engine optimization, Email Marketing, Analytics And Reporting, Collaboration, Paid Advertising, Blog.
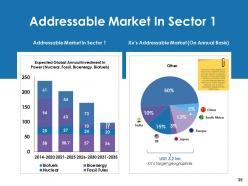
Slide 35: This slide showcases Addressable Market In Sector 1. Show the market potential in each of your segment and try to be as realistic as possible. You can use two approaches: 1. Bottom-up approach where you calculate and show the working or 2. direct approach where do you do some secondary research for the market size
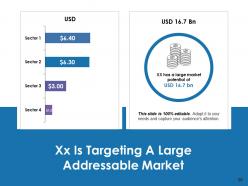
Slide 36: This slide presents Xx Is Targeting A Large Addressable Market. Add the data and use it accordingly.
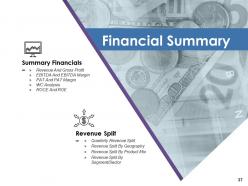
Slide 37: This slide showcases Financial Summary with Summary Financials and revenue split.
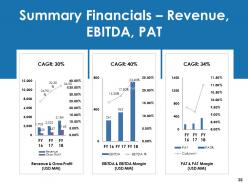
Slide 38: This slide shows Summary Financials – Revenue, EBITDA, PAT. Add the data and use as per your need.
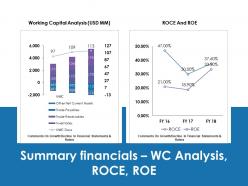
Slide 39: This slide presents Summary financials – WC Analysis, ROCE, ROE. Use and analyse the data as per your need.
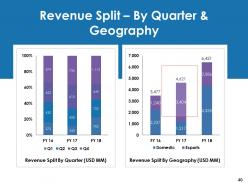
Slide 40: This slide showcases Revenue Split – By Quarter & Geography with Revenue Split By Quarter (USD MM) and Revenue Split By Geography (USD MM).
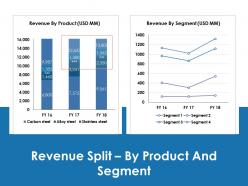
Slide 41: This slide shows Revenue Split – By Product And Segment. You can add the data in Revenue By Product (USD MM) and Revenue By Segment (USD MM).
Slide 42: This slide presents Client Testimonials. You can add your own information and use it.
Slide 43: This slide is a Coffee Break image for a halt.
Slide 44: This slide forwards to Charts & Graphs.
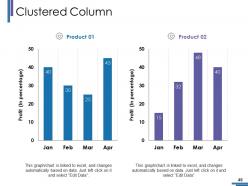
Slide 45: This slide presents Clustered Column. Use this graph and make use of it.
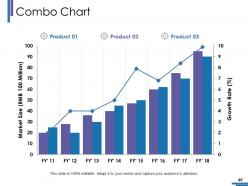
Slide 46: This slide showcases Combo Chart. You can add the product the details.
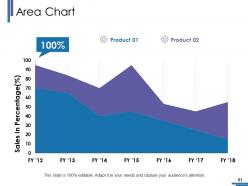
Slide 47: This slide showcases Area Chart. You can add the product the details.
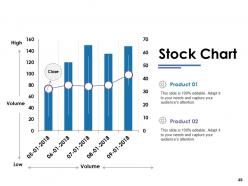
Slide 48: This slide displays a Stock Chart with volume as parameter in terms of high and low, open and close.
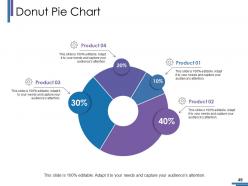
Slide 49: This slide presents Donut Pie Chart. Add the data nad make use of it.
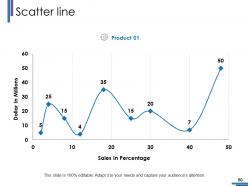
Slide 50: This slide presents Scatter line and you can add the data as you want.
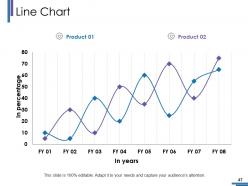
Slide 51: This slide shows a Line Chart for two product comparison.
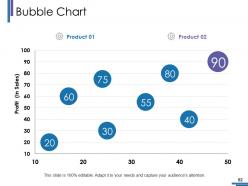
Slide 52: This slide presents Bubble Chart. Add your own requirement and make use.
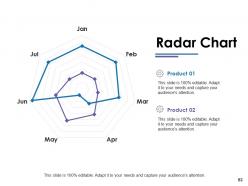
Slide 53: This slide showcases Radar Chart. You can add the product the details.
Slide 54: This slide is titled Additional slides.
Slide 55: This slide contains Our Mission with text boxes.
Slide 56: This slide showcases Our Team with Name and Designation to fill.
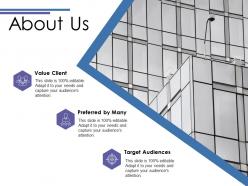
Slide 57: This slide helps show- About Our Company. The sub headings include- Creative Design, Customer Care, Expand Company.
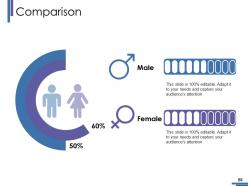
Slide 58: This slide shows Comparison of number of users and Time.
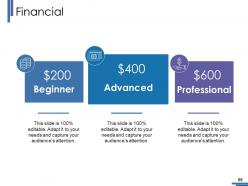
Slide 59: This is a Financial Score slide to show financial aspects here.
Slide 60: This is a Quotes slide to convey message, beliefs etc.
Slide 61: This is a Dashboard slide to show- Strategic System, Success, Goal Process, Sales Review, Communication Study.
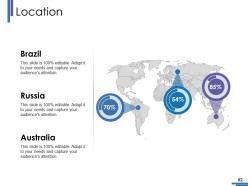
Slide 62: This is a Location slide to show global growth,presence etc. on world map.
Slide 63: This slide shows an image with text boxes titled Business Person with Post It notes.
Slide 64: This is a Timeline slide to show milestones, growth or highlighting factors.
Slide 65: This is a Puzzle image slide to show information, specification etc.
Slide 66: This is a Circular image slide to show information, specifications etc.
Slide 67: This slide shows Target image with text boxes.
Slide 68: This is a Venn diagram slide to show information etc.
Slide 69: This slide presents a Mind map with text boxes
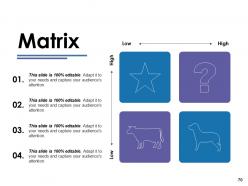
Slide 70: This slide showcases a Matrix with the following content- Development Clients, Dilemna Clients, Star Clients, High Value Clients.
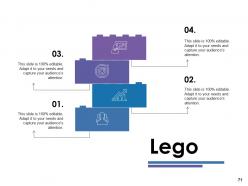
Slide 71: This is a Lego Box slide with the following subheadings- Teach, Encourage, Increase, Build.
Slide 72: This is a Silhouettes image slide with the subheadings- INVENTORY, PAYMENT, CASH, CREDITCARD, CHECKOUT.
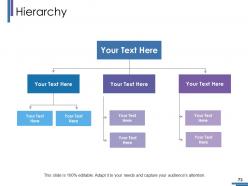
Slide 73: This slide presents Hierarchy. You can add the company management and make use of it.
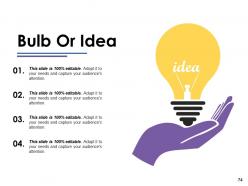
Slide 74: This is a Bulb Or Idea image slide to show information, innovative aspects etc.
Slide 75: This is a Funnel image slide showing: Calls-to-action, Reachability, User Experience, Color Schemes, Engagement, Simplicity.
Slide 76: This is a Thank You image slide with Address, Email and Contact number.
Investment Funds Powerpoint Presentation Slides with all 76 slides:
Everyone expresses their inner glee due to our Investment Funds Powerpoint Presentation Slides. It ensures the gathering becomes jolly.


FAQs for Investment Funds
So you've got a bunch of options here. Mutual funds have managers picking stocks for you, while index funds just follow the market automatically. ETFs are kinda like index funds but you can buy/sell them anytime during the day. There's also bond funds if you want steady income, money market funds for super safe stuff, and hedge funds (though those are for rich people honestly). My advice? Just start with index funds or ETFs - they're cheap and you don't have to overthink it. I wish someone told me that years ago instead of letting me stress about all the choices!
So basically ETFs trade like stocks - you can buy/sell whenever markets are open and get real-time prices. Mutual funds? You're stuck waiting until after close for pricing, which honestly feels pretty outdated these days. ETFs usually have lower fees too and are more tax-efficient. But mutual funds let you start with less money upfront and have automatic investing features. Oh, and mutual funds sometimes let you do fractional shares easier. If you want more control and don't mind being hands-on, I'd probably go with ETFs.
Start with fees - those expense ratios add up way more than you'd think. Performance history is worth checking but honestly, past results don't mean much for the future. How much risk can you handle? Some funds own like 500 companies, others focus on just their top picks. I'm personally a fan of broader diversification but that's just me. Look into who's actually managing the thing and their strategy. Does it match what you're trying to do? Oh, and make a simple comparison chart with your top 3-4 options. Way easier to see the differences that way.
So fund managers are the people who actually decide where your money goes. They're researching stocks, picking what to buy/sell, and timing everything based on the fund's game plan. Honestly, a great manager can totally change your returns - I've seen it happen. They spend their days watching markets, crunching numbers, tweaking portfolios to hit targets without taking crazy risks. When you're shopping for funds, definitely check out the manager's past performance and how they think about investing. Some are way more aggressive than others, which might not be your thing.
So fund companies have to follow a ton of SEC rules - like sending you those crazy thick prospectuses that nobody actually reads lol. The main thing is they're legally required to put your interests first as a fiduciary. There are also limits on what they can invest in and how concentrated their holdings can be. Honestly, most people skip this step, but you should check that your fund is properly registered before putting money in. Those compliance docs are boring but worth skimming at least.
Think of expense ratios like the annual fee for owning a fund - it's a percentage that gets taken out of your money every year. So if your fund makes 8% but charges 1%, you only get 7%. Those "small" differences? They add up big time over the years. I'm talking thousands lost on a normal portfolio. Compare ratios when you're looking at similar funds because paying more doesn't mean you'll get better results. Honestly, most funds charging over 1% are just ripping you off. Stick to anything under 0.5% and you'll be fine.
Honestly, check the performance over different time periods - 1, 3, 5, 10 years if you can. But don't get hung up on just returns. Look at how bumpy the ride's been compared to similar funds. Expense ratios are huge too - those fees add up like crazy over time. Morningstar's pretty solid for comparing funds side by side, though their site can be a bit clunky sometimes. The fund manager's track record matters - how long have they been running things? Pull up the fact sheet and stack it against 3 or 4 competitors before you commit.
Your fund returns basically mirror what's happening in the economy. Equity funds do great when markets are climbing, but they tank during recessions. Bond funds are weird though - they can actually do well when everything else is crashing because interest rates drop. Growth funds? Total bloodbath in 2022, honestly brutal to watch. Commodity funds go nuts during inflation spikes. Here's the thing - every fund gets pulled around by these big economic forces whether you like it or not. Mix up your fund types and don't put everything on the same timeline. It helps smooth out the crazy swings.
So basically funds spread your cash across tons of different stuff automatically - stocks, bonds, international markets, whatever. You don't have to research each company yourself, which honestly saves so much time. Most funds hold hundreds or even thousands of investments. It's like buying a variety pack instead of picking everything individually. Pretty smart way to reduce risk without doing all the work. Just make sure you actually look at what the fund invests in first - some are way more aggressive than others and you'll want something that matches how much risk you can handle.
Honestly, the biggest problem is you're basically betting everything on one industry. Tech funds got crushed in 2000, energy tanked when oil crashed - it happens. These funds swing way harder than regular market funds because there's nothing to balance things out. You might jump in when everyone's hyped about that sector (probably when it's overpriced) and then sit there for years waiting for it to bounce back. If you really want to do this, just use a tiny piece of your portfolio and maybe spread your buys out over time instead of dumping it all in at once.
So passive funds just copy an index like the S&P 500 - they buy everything in there and call it a day. Active funds? Managers are constantly picking stocks, doing research, trying to beat the market. Plot twist though - most active funds actually do WORSE than the market after you factor in fees. Passive funds charge like 0.1% while active ones hit you with 1% or more. That adds up fast. Honestly, unless you really think some fund manager is the next Warren Buffett, passive is probably your best bet. Lower fees, less headache.
So tax stuff varies a lot by fund type. Mutual funds hit you with taxable gains every year even when you don't sell anything - which is honestly pretty annoying. ETFs are way better for taxes usually. Index funds also beat actively managed ones on this front. The weird part? You might owe taxes on gains you never actually got as cash. Your tax bracket matters tons, plus whether it's in a regular account or retirement one. Definitely worth chatting with a tax person before doing anything big though.
Honestly, ESG funds are way better than I expected when I first looked into them. Some actually beat regular funds, which was a nice surprise. Start by checking what you already own - you can probably swap some holdings for sustainable options without messing up your diversification. Just make sure to look at their actual holdings and expense ratios first. Most big fund companies have ESG versions now across different types of investments. The trick is finding ones that match your values but still perform well. I mean, there's no point in sacrificing returns if you don't have to, right?
So most funds use a mix of strategies. Strategic allocation is the baseline - they set target percentages for stocks, bonds, whatever based on their risk goals. Tactical is more fun though - that's when they temporarily shift things around to catch market opportunities. Dynamic allocation means they're constantly tweaking based on what's happening. Honestly, the smart funds don't just pick one approach. They blend all three depending on what's going on. I'd definitely look up what your fund does before you throw money at it - some are way more active than others.
Funds basically rebalance their portfolios all the time based on market data and what investors are asking for. They'll jump between sectors or totally flip their investment approach when things change. Honestly, some are way better at this than others - it's kinda wild how different they can be. Quick example: they might launch ESG products or inflation protection stuff because that's what people want now. The real thing to watch? How fast your fund actually responds when markets go crazy and whether they bother telling you what they're doing. Some funds are honestly just slow to react.
-
Attractive design and informative presentation.
-
Very unique and reliable designs.