

Detailed Investment Analysis Powerpoint Presentation Slides


Try Before you Buy Download Free Sample Product
 Impress Your
 Audience
Editable
of Time


Create a financial analysis report with our topic-specific Detailed Investment Analysis Powerpoint Presentation Slides. The content ready investment evaluation PowerPoint complete deck has various professional looking PPT slides such as introduction to investments, objectives of portfolio management, types of investment, market scenario overview investment instruments, securities portfolio, analysis and valuation of equity securities, industry analysis PESTEL, SWOT analysis, discounted cash flow method, financial statement analysis, company cash flow statement, issues inefficient markets, technical analysis types, investment in special situations, fixed income and leveraged securities, bond valuation system, reinvestment risk table, type of convertible securities, options analysis, warrants summarization overview, derivative products, put and call options, stock index futures and options, stock indexes comparison table, broaden the investment perspective, international security market highlights, global market trends, mutual funds investment criteria overview, investment in real estate, diversified real estate classification, KPIs and dashboards, etc. Download investment management presentation deck to showcase asset allocation management plan. Give folks an example of your high degree of erudition with our investment ppt Slides. Be able to display impressive credentials.
People who downloaded this PowerPoint presentation also viewed the following :
Content of this Powerpoint Presentation
Slide 1: This slide introduces Detailed Investment Analysis. State Your Company Name and begin.
Slide 2: This is an Agenda slide. State your agendas here.
Slide 3: This slide shows Table of Content for the presentation.
Slide 4: This slide presents Introduction to Investments describing- Objectives of Portfolio Management, Investment Instruments, Types of Investment, Market Scenario Overview.
Slide 5: This slide displays Objectives of Portfolio Management describing- Capital Growth, Marketability, Liquidity, Consistency of Returns, Diversification of Portfolio, Objective.
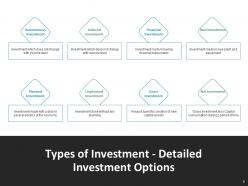
Slide 6: This slide represents Types of Investment - Detailed Investment Options describing- Autonomous Investment, Induced Investment, Financial Investment, Real Investment, Planned Investment, Unplanned Investment, Gross Investment, Net Investment.
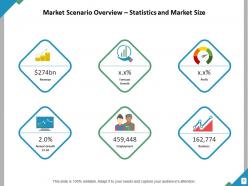
Slide 7: This slide showcases Market Scenario Overview - Statistics and Market Size describing- Revenue, Annual Growth 13-18, Forecast Growth, Profit, Employment, Business.
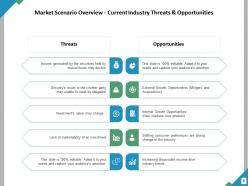
Slide 8: This slide shows Market Scenario Overview - Current Industry Threats & Opportunities with related text to elaborate.
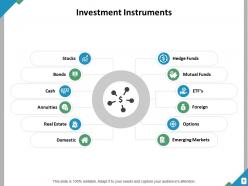
Slide 9: This slide presents Investment Instruments which includes- Stock, Annuities, Bond, Cash, Real Estate, Mutual Funds, Domestic, Hedge Funds, ETF’s, Emerging Markets, Foreign Options.
Slide 10: This slide displays Investment Instruments - Funds Categorization and Risk Involved as- Liquid funds, Ultra - short term funds, Short term funds, Corporate bond funds, Long term bond funds, Long term G-sec funds, MIP with less than 25% equity.
Slide 11: This slide represents Top Performing Securities in Our Portfolio with categories as- Investor’s Portfolio, Investment, Percentage, Security, Returns.
Slide 12: This slide showcases Analysis and Valuation of Equity Securities describing- Industry Analysis, Financial Statement Analysis, Valuation of Equity Securities.
Slide 13: This slide shows Industry Analysis - Porter’s 5 Forces as- Competition/Rivalry, Bargaining Power -Suppliers, Barriers To Entry, Threat of Substitutes, Bargaining Power Buyers.
Slide 14: This slide presents Industry Analysis - PESTEL Analysis which include Political, Economic, Social, Technological, Environment and Legal analysis.
Slide 15: This slide displays Industry Analysis - SWOT Analysis as- Strengths, Weaknesses, Opportunities and Threats analysis.
Slide 16: This slide represents Valuation of Equity Securities describing- Net Asset Value Method, Maintainable Profit Method or Discounted Cash Flows Method, Comparable Company Market Multiple, Price / Earnings multiple, Market Cap/ Sales Multiple, Industry Valuation Benchmarks.
Slide 17: This slide showcases Valuation of Equity Securities - Discounted Cash Flow Method describing- DCF Valuation, Projected Free Cash Flow, Perpetuity Growth Rate Approach.
Slide 18: This slide shows Financial Statement Analysis - P&I Statement in Tabular form with net sales, total income, total expenses, profit before and after tax etc.
Slide 19: This slide presents Balance Sheet in Tabular form with total liabilities.
Slide 20: This slide presents Balance Sheet in Tabular form with total assets.
Slide 21: This slide displays Company Cash Flow Statement in Tabular form describing- Cash flow from operations, cash flow from investing activities, cash flow from financing activities, change in cash and cash equivalents etc.
Slide 22: This slide represents Issues in Efficient Markets describing- Major Efficient Market Issues, Investments in Special Situation, Basic View of Technical Analysis.
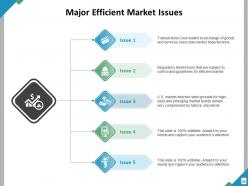
Slide 23: This slide showcases Major Efficient Market Issues as- Transactions Cost related to exchange of goods and services overcome market imperfections, Regulatory Restrictions that are subject to control and guidelines for efficient market etc.
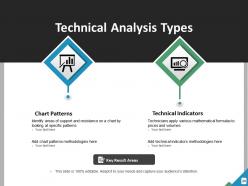
Slide 24: This slide shows Technical Analysis Types with chart patterns, technical indicators and key result areas.
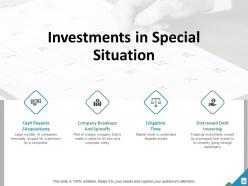
Slide 25: This slide presents Investments in Special Situations with icons and text boxes to show information.
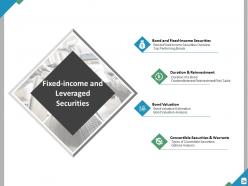
Slide 26: This slide displays Fixed-Income and Leveraged Securities describing- Bond and Fixed-Income Securities, Convertible Securities & Warrants, Duration & Reinvestment, Bond Valuation.
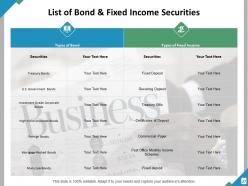
Slide 27: This slide represents List of Bond & Fixed Income Securities in a tabular form with related text.
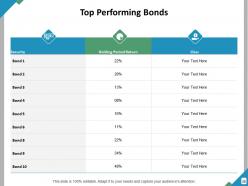
Slide 28: This slide showcases Top Performing Bonds with categories as- Security, Holding Period Returns, Class.
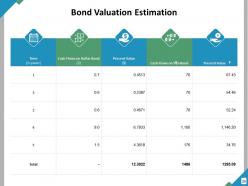
Slide 29: This slide shows Bond Valuation Estimation with categories as- Time, Cash Flows on Dollar Bond, Present Value, Cash Flows on Yen Bond, Present Value.
Slide 30: This slide presents Bond Valuation Analysis describing- Bond Valuation and Return Measures.
Slide 31: This slide displays Bond Duration with categories as- Period, Cash Flows, Period X Cash Flow, PV of $1 at 5%, Present Value of the Cash Flow.
Slide 32: This slide represents Dividend \ Interest Reinvestment Risk Table with categories as- Market Interest Rate, Investment Horizon, Dominance.
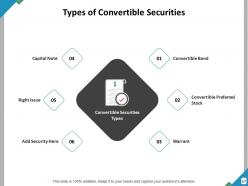
Slide 33: This slide showcases Types of Convertible Securities describing- Convertible Bond, Convertible Preferred Stock, Warrant, Capital Note, Right Issue.
Slide 34: This slide shows Options Analysis in tabular form with related text.
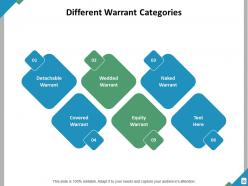
Slide 35: This slide presents Different Warrant Categories as- Detachable Warrant, Wedded Warrant, Naked Warrant, Covered Warrant, Equity Warrant etc.
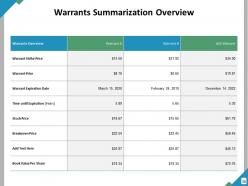
Slide 36: This slide displays Warrants Summarization Overview with warrant price, warrant expiration date, stock price etc.
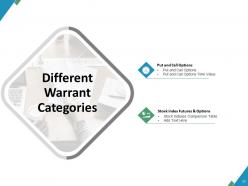
Slide 37: This slide represents Different Warrant Categories such as- Put and Call Options and Stock Index Futures and Options.
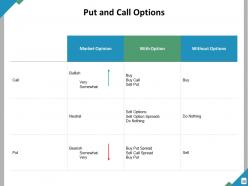
Slide 38: This slide showcases Put and Call Options with categories as Bullish, Neutral, Bearish.
Slide 39: This slide shows Put and Call Options Time Value in tabular form with categories as- Total Value, Time Value, Intrinsic Value, Strike Price, Intrinsic Value, Time Value, Total Value.
Slide 40: This slide presents Stock Index Futures and Options with categories as- Contract, Ticker Symbol, Futures, Options, Globex.
Slide 41: This slide displays Stock Indexes Comparison Table comparing exchanges such as- Korea exchange, Australia exchange, Hong kong stock exchange, bombay stock exchange etc.
Slide 42: This slide represents Broadening the Investment Perspective describing- International Security Markets, Investments in Real Assets, Mutual Funds.
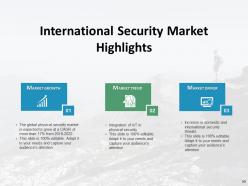
Slide 43: This slide showcases International Security Market Highlights describing- Market Growth, Market Trend, Market Driver.
Slide 44: This slide shows Recent Global Security Market Trends\Behavior describing- Inflation to Make a Comeback - But Only in the Us, Global Growth to Remain in Autopilot, Monetary Stimulus To Become Less Prevalent, Reduced Reward for Risk, Geopolitical Risks etc.
Slide 45: This slide presents Mutual Funds Investment Criteria Overview with parameters as- Equity, Balanced, Fixed Income, Money Market.
Slide 46: This slide displays Top 5 Mutual Funds to Invest in 2018-19 witch categories as- MUTUAL FUND, Crisil rank, Value research rating, Assets under management etc.
Slide 47: This slide represents Investments in Real Assets such as- Real Estate, Commodities, Natural Resource Equities, Infrastructure, Diversifies Real Assets Blend.
Slide 48: This slide shows Risk & Return Analysis in a tabular form with text boxes to show information.
Slide 49: This slide presents Risk and Return of Portfolio Managers in Tabular form with years, security risk, security return etc.
Slide 50: This slide displays KPI & Dashboard describing- KPI Dashboard and KPI Metrics.
Slide 51: This slide represents Portfolio Management Dashboard with- Allocations, Sectors, Regions, Net Worth, Holdings, Net Flow, Transactions.
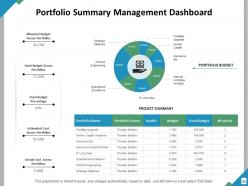
Slide 52: This slide showcases Portfolio Summary Management Dashboard with- Portfolio Name, Portfolio Owner, Health, Budget, Used Budget, Projects.
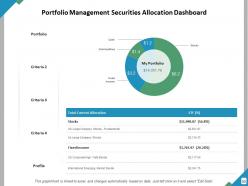
Slide 53: This slide shows Portfolio Management Securities Allocation Dashboard with Portfolio, Criterias, Profile etc.
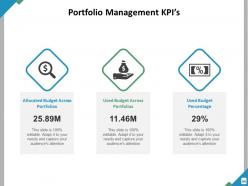
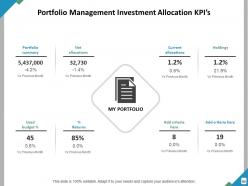
Slide 54: This slide presents Portfolio Management KPI’s describing- Allocated Budget Across Portfolios, Used Budget Percentage, Used Budget Across Portfolios.
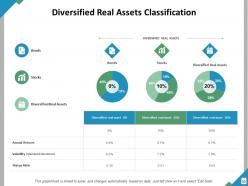
Slide 55: This slide showcases Diversified Real Assets Classification describing- annual returns, Volatility, Shape ratio etc.
Slide 56: This slide represents Derivative Products such as- Put and Call Options and Stock Index Futures and Options.
Slide 57: This slide showcases Types of Convertible Securities describing- Convertible Bond, Convertible Preferred Stock, Warrant, Capital Note, Right Issue.
Slide 58: This is a slide to show six Different warrant categories.
Slide 59: This slide presents International Security Market Highlights describing- MARKET GROWTH, MARKET DRIVER, MARKET TREND.
Slide 60: This slide displays Portfolio Management Investment Allocation KPI’s Portfolio Summary Net Allocation Used Budget percentage, Current allocations etc.
Slide 61: This slide showcases Detailed Investment Analysis – Icons.
Slide 62: This slide is titled as Additional Slides for moving forward.
Slide 63: This slide reminds about a Coffee Break.
Slide 64: This is a Quotes slide to convey message, beliefs etc.
Slide 65: This is Our Mission slide with imagery and text boxes.
Slide 66: This is Meet the Team slide with names and designation.
Slide 67: This is an Idea Bulb slide to state a new idea or highlight information, specifications etc.
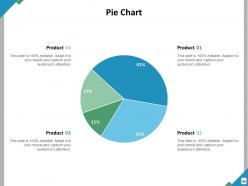
Slide 68: This slide shows Pie Chart with data in percentage.
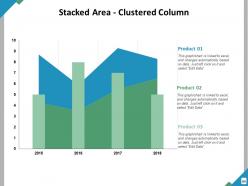
Slide 69: This slide displays Stacked Area - Clustered Column chart with three products comparison.
Slide 70: This slide presents Clustered Bar chart with three products comparison.
Slide 71: This is a Thanks For Watching slide with address, contact numbers and email address.
Detailed Investment Analysis Powerpoint Presentation Slides with all 71 slides:
Use our Detailed Investment Analysis Powerpoint Presentation Slides to effectively help you save your valuable time. They are readymade to fit into any presentation structure.
-
Detailed Investment Analysis
-

Agenda
-
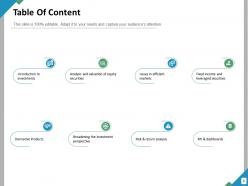
Table Of Content
-
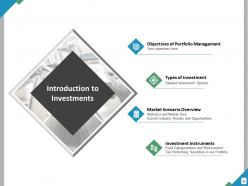
Introduction to Investments
-
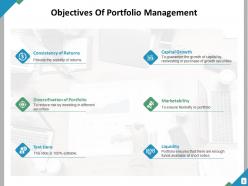
Objectives Of Portfolio Management
-
Types of Investment Detailed Investment Options
-
Market Scenario Overview Statistics and Market Size
-
Market Scenario Overview Current Industry Threats Opportunities
-
Investment Instruments
-
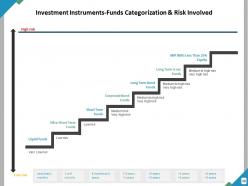
Investment Instruments Funds Categorization Risk Involved
-
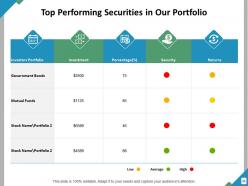
Top Performing Securities in Our Portfolio
-
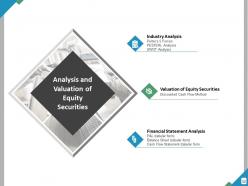
Analysis and Valuation of Equity Securities
-
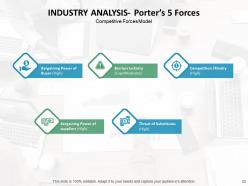
Industry Analysis Porter s Five Forces
-
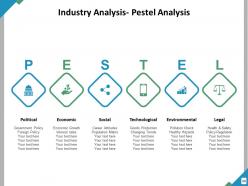
Industry Analysis Pestel Analysis
-
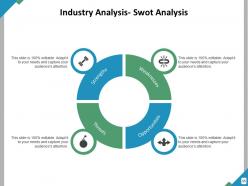
Industry Analysis SWOT Analysis
-
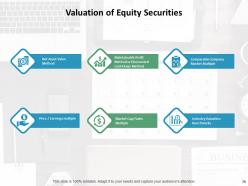
Valuation of Equity Securities
-
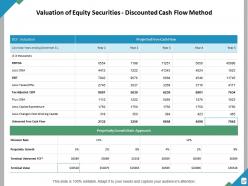
Valuation of Equity Securities Discounted Cash Flow Method
-
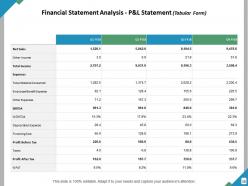
Financial Statement Analysis P L Statement Tabular Form
-
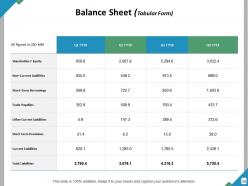
Balance Sheet Tabular Form
-
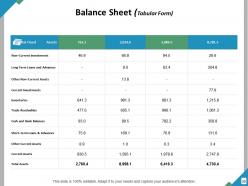
Balance Sheet Tabular Form
-
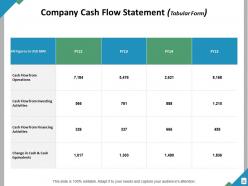
Company Cash Flow Statement Tabular Form
-
Issues in Efficient Markets
-
Major Efficient Market Issues
-
Technical Analysis Types
-
Investments in Special Situation
-
Fixed income and Leveraged Securities
-
List of Bond Fixed Income Securities
-
Top Performing Bonds
-
Bond Valuation Estimation
-
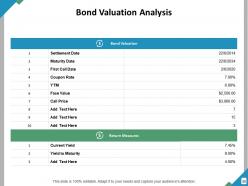
Bond Valuation Analysis
-

Bond Duration
-
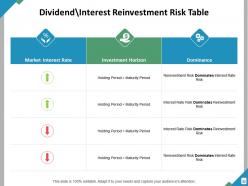
Dividend Interest Reinvestment Risk Table
-
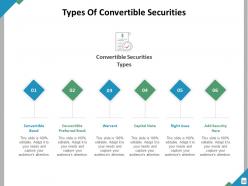
Types Of Convertible Securities
-
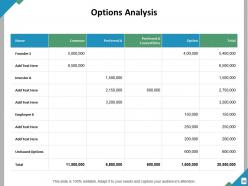
Options Analysis
-
Different Warrant Categories
-
Warrants Summarization Overview
-
Different Warrant Categories
-
Put and Call Options
-
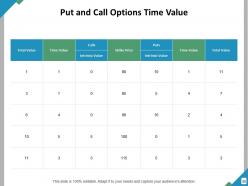
Put and Call Options Time Value
-
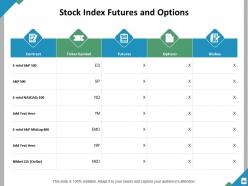
Stock Index Futures and Options
-

Stock Indexes Comparison Table
-
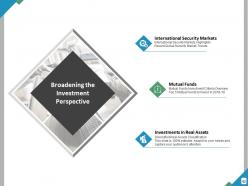
Broadening the Investment Perspective
-
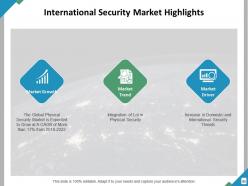
International Security Market Highlights
-
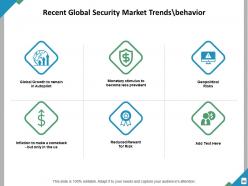
Recent Global Security Market Trends behavior
-
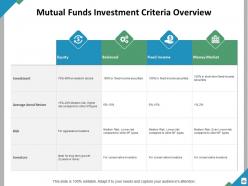
Mutual Funds Investment Criteria Overview
-
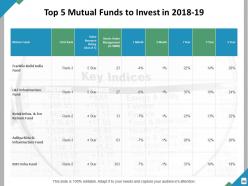
Top 5 Mutual Funds to Invest in 2018 19
-
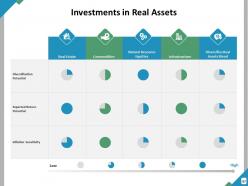
Investments in Real Assets
-
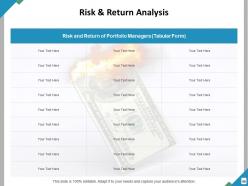
Risk Return Analysis
-
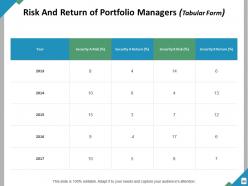
Risk And Return of Portfolio Managers Tabular Form
-
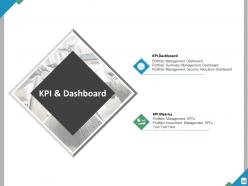
KPI Dashboard
-
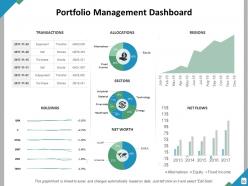
Portfolio Management Dashboard
-
Portfolio Summary Management Dashboard
-
Portfolio Management Securities Allocation Dashboard
-
Portfolio Management KPI s
-
Diversified Real Assets Classification
-
Derivative Products
-
Types of Convertible Securities
-
Different Warrant Categories
-
International Security Market Highlights
-
Portfolio Management Investment Allocation KPI s
-
Detailed Investment Analysis Icons Slide
-

Additional Slides
-

Coffee Break
-

Quotes
-

Our Mission
-

Meet the Team
-

Idea Bulb
-
Pie Chart
-
Stacked Area Clustered Column
-
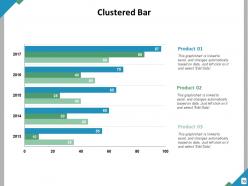
Clustered Bar
-

Thanks For Watching
FAQs for Detailed Investment Analysis
Look, start with ROI and NPV - they're pretty straightforward to calculate and won't confuse people when you're explaining your reasoning. ROI just gives you that basic percentage return, which everyone gets. NPV tells you if you're actually beating your target return in real dollars. IRR is handy too since it shows your breakeven discount rate, makes comparing different deals way easier. Oh, and payback period works great for simpler stuff - honestly underrated metric. Don't stress about having perfect numbers though. Sometimes you've got enough info to make a decent call and that's it.
So economic indicators are basically your heads-up for what's coming in the markets. GDP growth, unemployment, inflation, interest rates - these tell you where things are headed. When unemployment drops, people spend more and retail stocks usually do well. Consumer confidence gives you early warnings, while unemployment data confirms what already happened. Honestly, I'd start with just those four big ones since tracking everything gets overwhelming fast. They're solid for timing your moves better. Oh and don't overthink it - even the pros get it wrong sometimes.
So fundamental analysis is basically checking if a company's actually worth your money - you're looking at their earnings, debt, revenue, all that financial stuff. Technical analysis? That's just reading charts and price patterns to figure out timing. I honestly think most people overthink the technical side, but whatever works. Fundamentals tell you WHAT to buy, technicals tell you WHEN. Like, you'll want to know if the company's solid first, then use the charts to avoid buying at a terrible time. Most smart investors do both since they complement each other pretty well.
So basically, how much risk you can stomach plus your timeline are everything. Young with decades before retirement? Go heavy on stocks - crashes won't matter when you've got 30+ years to recover. Need the cash soon or hate watching your portfolio swing around? Stick with bonds and safer stuff. I always tell people time fixes most investing mistakes, which sounds cheesy but it's true. Just be real about what you can actually handle, because the "best" portfolio means nothing if you're gonna freak out and sell everything when things get ugly.
You need to spread your money across different stuff - stocks, bonds, maybe some international markets. That way if tech crashes or whatever, you're not totally screwed. It's like the old eggs in one basket thing, which honestly sounds cliche but actually works. Figure out what mix makes sense for your age and how much risk freaks you out. Then rebalance every few months when things get out of whack. I usually do it quarterly but sometimes I'm lazy and wait longer. The whole point is matching your timeline with how much volatility you can stomach.
So basically, whatever's happening in your industry totally changes how much people will pay for stocks. AI companies right now? Everyone's throwing money at them even if they're kinda meh. Meanwhile, if you're in something declining, good luck getting a decent valuation no matter how well you're doing. Markets can be pretty brutal that way. Growth trends and regulation shifts mess with investor feelings too - I swear sometimes it's more psychology than actual business fundamentals. Always scope out the industry vibe first before you try valuing anything, since that basically sets your starting point.
Look for companies trading way below what they're actually worth - compare their stock price to stuff like P/E ratios, book value, cash flow. I usually hunt for stocks below their historical averages or cheaper than similar companies. Sometimes the market totally overreacts to bad news, so you can find solid companies just going through rough patches. Technical analysis helps with timing too, though that's a whole other thing. Start screening for low P/E ratios in industries you get - tech, healthcare, whatever you follow. It's honestly like digging for gold most days.
Market sentiment creates these pricing gaps you can actually profit from. When everyone's freaking out, good companies get dumped way below what they're worth - perfect time to buy. Flip side? During crazy bull runs, garbage stocks get inflated like balloons (looking at you, AMC). I follow stuff like VIX and Reddit chatter to gauge the mood, but honestly don't make moves without checking if the company's actually solid first. Being contrarian works, but you can't be an idiot about it. Wait for those extreme swings where emotion totally overrides logic.
Yeah, geopolitical stuff can totally mess up your investments if you're caught off guard. Markets hate uncertainty - trade wars, sanctions, conflicts, political drama - it all makes investors freak out and dump stocks. Money floods into safe stuff like gold or treasuries instead. Currency swings hit your international stocks hard too. Oil goes crazy during Middle East tensions (ugh, 2019 was brutal for my energy picks). Honestly, spreading your money across different regions and sectors helps a ton. Keep some cash handy so you can actually buy when everyone else is panic-selling.
Index funds are honestly the way to go for most of your money - dirt cheap fees, you get the whole market, and zero stress about picking stocks. Sure, active investing sounds exciting and you might beat the market, but those fees add up fast. Plus most fund managers can't even beat a basic S&P 500 fund anyway, which is pretty embarrassing when you think about it. I'd say do like 80% index funds, then maybe throw 20% at some individual picks or active funds if you want to scratch that itch. That's what I do and it's worked out well so far.
So bond prices and interest rates move in opposite directions - rates go up, your bonds lose value because new ones pay better. Stocks are messier though. Companies hate higher rates since borrowing costs more, which hurts growth. But rising rates also mean the economy's doing well, so earnings could be solid. Tech gets crushed the worst - all those future profits look less appealing when discounted at higher rates. The whole thing's pretty unpredictable honestly. I'd just spread your money across both and don't try timing it perfectly.
Yeah, ESG stuff is actually worth looking into now. Environmental impact, how they treat workers, board diversity - that whole thing. Companies with sketchy labor practices or terrible environmental records? They're getting hammered by investors lately. Plus honestly, millennials care about this stuff way more than previous generations did. I'd just add some basic ESG screening to whatever analysis you're already doing. Check for major red flags that might blow up later - executive compensation scandals, environmental lawsuits, you know. It's not just feel-good anymore, it genuinely affects their bottom line these days.
Dude, AI and big data are game-changers for investment stuff. They'll crunch way more info than you ever could - like analyzing thousands of stocks at once and catching patterns humans totally miss. Real-time sentiment tracking from news and social media is pretty sick too. What blows my mind is how AI can backtest decades of data in literally minutes. Machine learning gets smarter as it processes more info, which is honestly kind of scary but useful. I'd say start with basic AI stock screeners first. Don't jump into the deep end right away - work your way up to fancier analytics once you're not completely lost.
So you know how you sometimes make dumb money moves even though you *know* they're dumb? That's behavioral finance in a nutshell. Our brains have these weird biases - like only reading news that backs up what we already think, or hanging onto losing stocks forever because selling feels awful. Overconfidence is probably the worst one honestly. I keep a little notebook where I write down why I'm buying something, then check back later to see how wrong I was lol. Setting up automatic investing helps too since it cuts out all the emotional stuff.
Look, you want to shift your allocation based on economic cycles, but honestly? Perfect timing is a myth. Growth stocks and tech do well during expansions. When recession vibes hit, rotate into boring stuff - utilities, staples, bonds. I'd track yield curves and employment data to spot shifts early. Make gradual moves though, not dramatic swings that'll wreck you. Keep some diversification no matter what (I learned this the hard way in 2020). Don't go all-in on anything - that's gambling, not investing.
-
Qualitative and comprehensive slides.
-
Excellent Designs.