Balance sheet calculation with financial dashboard

Rating:
90%
Balance sheet calculation with financial dashboard
Slide 1 of 2

or

Favourites Favourites

Try Before you Buy Download Free Sample Product

Audience Impress Your
Audience
Editable 100%
Editable
Time Save Hours
of Time
The Biggest Sale is ending soon in
0
0
:
0
0
:
0
0
Rating:
90%
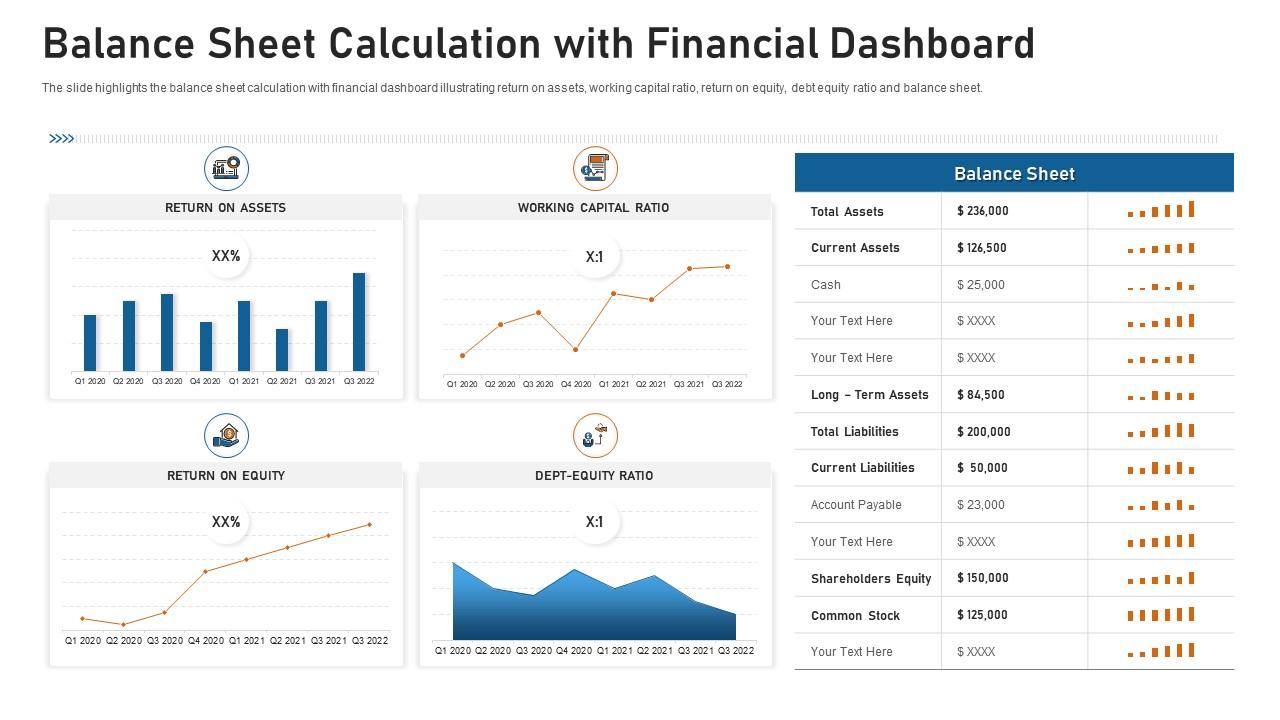
Introducing our Balance Sheet Calculation With Financial Dashboard set of slides. The topics discussed in these slides are Working Capital, Equity Ratio, Return On Assets. This is an immediately available PowerPoint presentation that can be conveniently customized. Download it and convince your audience.

FAQs for Balance sheet calculation

Break down the balance sheet into three chunks: assets, liabilities, and equity. Current vs non-current assets will tell you about liquidity. Debt levels are in liabilities - that's crucial stuff. But honestly? The ratios are what really matter. Current ratio, debt-to-equity, return on assets - those give you the actual story. One period is basically useless though, you need at least 2-3 years of data to see what's actually happening. I always look at quarter-over-quarter changes too. Helps catch problems before they get ugly. The equity section shows retained earnings and ownership value, which is pretty straightforward once you get the hang of it.

So basically, liquidity shows if you can actually pay your bills when they're due - think of it as your company's financial cushion. The current ratio and quick ratio are what you want to look at here. Cash, receivables, and inventory make up your liquid assets. Honestly, I've seen too many profitable companies tank because they couldn't cover short-term debts. If your ratios drop below 1.0, that's when things get sketchy and you'll be scrambling for cash. It's really just current assets vs current liabilities - pretty straightforward math but super critical for staying afloat.

So high debt-to-equity basically means they borrowed a ton of money. Returns can be crazy good when things go well, but if cash flow tanks? Yikes. Interest payments start crushing profits and lenders get sketchy about it. Companies with low ratios play it safe - less risky for sure, but maybe they're missing out on growth. Sometimes being too careful backfires too, honestly. You gotta compare it to other companies in the same industry though. What's normal for tech is totally different than utilities or whatever. And check if it's getting worse over time - that's way more telling than just one number.

So asset composition trends basically tell you where your company's cash is actually going. More money sitting around? Probably time to invest or tackle some debt. Inventory growing could mean you're expanding - or honestly, it might signal cash flow problems down the road. Fixed assets going up usually means you're betting on future revenue capacity. Compare your numbers to competitors though, that's where the real insights are. Quarter-to-quarter ratios will show you the patterns. Then you can figure out your next moves from there.

So working capital is basically current assets minus current liabilities - shows you if a company can cover its short-term stuff without scrambling for cash. Positive trends usually mean they're getting better at managing money flow. But here's the thing - you can't just look at one number and call it good. Compare it over time instead. Seasonal businesses will look totally different than, say, a utility company or whatever. Also check what's actually driving big changes - did they just take on debt or sell off inventory? Context is everything with this ratio honestly.

Intangible assets mess with book value in weird ways. Patents, trademarks, software - they all show up on the balance sheet at cost or fair value. But here's the thing: they depreciate through amortization, plus goodwill can get slammed with massive writedowns if it's "impaired." Those quarterly calls get awkward fast when that happens. Check the notes to see how realistic management's valuations actually are. Also compare their intangible-to-total-assets ratio with competitors - might catch some red flags or hidden gems you missed.

Inventory changes tell you a ton about how things are actually going. More inventory could mean you're gearing up for big sales, or it might mean stuff isn't moving and you're burning cash. Less inventory usually means sales are hot, but sometimes it just means your suppliers are being weird. I always look at turnover ratios with the raw numbers - way more useful that way. The real trick is comparing your inventory moves to actual sales trends. Are they matching up? That's where you'll find out what's really happening with your business.

So high current liabilities mean the company might not have enough cash to pay what's due in the next year. Think of it like having rent, credit cards, and car payments all due but your bank account is looking rough. Check their current ratio - can their assets actually cover these debts? Sometimes it just means they're using short-term loans heavily (which honestly isn't always terrible). But yeah, it could signal cash flow issues ahead. Quick ratio is worth looking at too. Poor working capital management is usually the culprit when these numbers get wonky.

Dude, you gotta look at multiple quarters to catch the real patterns. Single balance sheets are basically useless - like judging someone's spending habits from one day. Pull maybe 3-5 periods and watch how debt's moving, whether cash is piling up or disappearing. I always start with the big line items first since that's where the drama usually is. Watch for stuff like debt-to-equity getting worse over time or working capital shrinking. Those trends will smack you in the face once you line them up side by side, but you'd totally miss them looking at just one snapshot.

So shareholder equity is basically what the company's actually worth to shareholders once they pay off all their debts. Assets minus liabilities, you know? It's like your personal net worth - what you own minus what you owe. Growing equity usually means the company's doing well and building value. Shrinking equity? That's when I'd start asking questions. Don't just look at the raw number though - compare it to past years and see how competitors are doing. Consistent growth matters way more than one big number. Also check if they're just buying back shares to inflate it (sneaky but common).

Dude, off-balance-sheet stuff is basically financial hide-and-seek. Companies stash operating leases, guarantees, and joint venture commitments where you won't easily spot them. But here's the thing - those are real obligations that'll bite later. It's like your roommate saying they're broke while secretly maxing out cards you don't know about. These hidden items can totally flip your read on whether a company's actually healthy or drowning in debt. Footnotes are boring as hell, but that's where they bury this stuff. Always worth checking before you invest.

So basically, a balance sheet shows what a company owns vs what it owes at one moment in time. You can check if they've got enough cash to cover short-term bills and see how much debt they're carrying compared to their equity. Think of it like peeking at someone's bank account and credit card statements. The real trick is looking at several quarters in a row - one snapshot doesn't tell you much. Also compare them to similar companies in their industry. Numbers without context are pretty useless, honestly.

Balance sheets are basically just a snapshot - you're missing how things change over time. Companies can mess with the numbers through different accounting tricks too. The really valuable stuff like brand reputation or how good your team is? Doesn't show up anywhere on there. Also, everything's listed at what it cost historically, not what it's actually worth today. Kind of annoying tbh. You'll get way better insights if you look at cash flow and income statements alongside it. Don't rely on just one financial statement when you're trying to figure things out.

So the financial structure is basically what shapes how their balance sheet looks. Debt-heavy companies? You'll see liabilities all over the place on the right side. Equity-focused ones show way more in shareholders' equity instead. It also changes how they report their financing stuff and which ratios actually matter. Complex companies usually have a ton more footnotes to wade through - kind of annoying honestly. When you're looking at it, just double-check that their structure makes sense for whatever industry they're in. That's usually a good starting point.

Look at debt-to-equity first - shows how much you're borrowing compared to similar companies. Current and quick ratios are clutch for seeing if your cash flow is actually decent. ROA is brutal but necessary since it reveals how well you're using what you've got. If you're in manufacturing or something asset-heavy, throw in asset turnover too. Oh and equity multiplier, though that one's kind of a pain to calculate. Just don't compare yourself to some massive corporation when you're still small - find companies that actually match your size and setup.

Ratings and Reviews

90% of 100
Review Form
Write a review
Most Relevant Reviews
  1. 100%

    by Ed Lawrence

    Content of slide is easy to understand and edit.
  2. 80%

    by Denis Rose

    The content is very helpful from business point of view.

2 Item(s)

per page: