


Business Forecasting Dashboard Snapshot With Sales Funnel


Try Before you Buy Download Free Sample Product
 Impress Your
 Audience
Editable
of Time


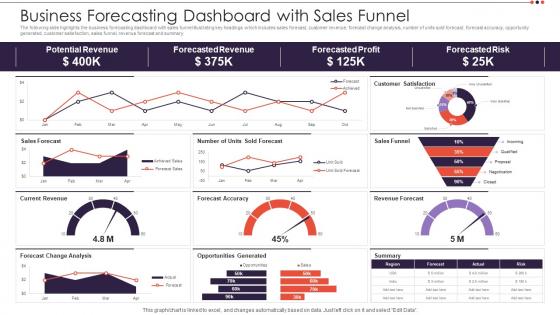
The following slide highlights the business forecasting dashboard snapshot with sales funnel illustrating key headings which includes sales forecast, customer revenue, forecast change analysis, number of units sold forecast, forecast accuracy, opportunity generated, customer satisfaction, sales funnel, revenue forecast and summary
People who downloaded this PowerPoint presentation also viewed the following :
Business Forecasting Dashboard Snapshot With Sales Funnel with all 7 slides:
Use our Business Forecasting Dashboard Snapshot With Sales Funnel to effectively help you save your valuable time. They are readymade to fit into any presentation structure.


FAQs for Business Forecasting Dashboard Snapshot
So there's basically two main types - qualitative stuff like expert opinions and surveys, then quantitative which uses historical data and math models. Time series analysis is solid when you've got stable patterns to work with. Regression gets useful when multiple factors matter, like seasonal changes or economic shifts. Qualitative's your friend when data's sketchy or nonexistent. Honestly? The best forecasts usually mix both approaches instead of going all-in on one. I'd say start with whatever data you can actually get your hands on and just build from there.
Look, historical data is like your business's diary - shows you patterns and what actually works. You'll spot seasonal stuff, growth trends, how outside events messed with your numbers. Honestly, trying to forecast without it is like driving with your eyes closed (terrible idea). Collect at least 2-3 years of solid data first. Then hunt for patterns that repeat - those are your goldmine for predictions. More quality data means your models can tell the difference between real signals and just random chaos. Trust me, it's worth the effort upfront.
Honestly, tech makes such a huge difference for forecasting - way faster and more accurate. Machine learning spots patterns you'd totally miss doing it by hand. Cloud computing crunches massive amounts of data in minutes instead of taking forever. The AI stuff automatically tweaks your models when new data rolls in, which is pretty sweet. Plus you get those slick dashboards that actually make sense when you're presenting to people. Oh, and don't try to automate everything at once - that's a recipe for chaos. Start small with something like automated data cleaning first.
Yeah, external stuff will mess up your forecasts big time if you ignore it. Things like inflation and interest rates hit everything - what people buy, what suppliers charge, demand patterns. 2020 was brutal for this - our models were completely useless! What works is building different scenarios instead of just looking at old data. I'd pick maybe 3-4 economic indicators that really matter for your space and check them regularly. Honestly, stress-testing your assumptions becomes second nature once you start. You'll catch problems way earlier than if you're just hoping historical trends continue.
Watch out for getting too attached to old data - markets change fast. Personal bias will totally screw you over if you're not careful. Don't make super precise forecasts either, think ranges instead. External stuff always hits harder than you expect (learned that one the hard way). Never do the whole "set it and forget it" thing. Your forecasts need constant updates when new info drops. Mix up your forecasting methods and get different people to challenge your assumptions. Scenario planning saves your butt too. Treat forecasts like rough drafts you'll tweak monthly, not some permanent gospel truth.
Honestly, start with surveys and customer reviews - that's your goldmine right there. Talk to people directly too. The hard part is turning all those opinions into actual numbers you can work with. Hunt for patterns in what they're saying about future purchases or spending plans. Happy customers usually come back, so track satisfaction scores. Your sales team hears this stuff all day, so tap into that knowledge regularly. Oh, and don't overthink it at first - just pick one feedback method and create a basic scoring system around it. You can always expand later once you've got the hang of it.
Honestly, MAPE is your best friend here - it shows what percentage you're off by, which is super easy to explain to your boss. I'd also check forecast bias to see if you're always predicting too high or low. MAD used to be my go-to but MAPE just makes more sense for presentations. One thing that surprised me: your short-term forecasts might be decent while longer ones totally suck. So track accuracy across different time periods. Don't go crazy trying to measure everything though - pick like two metrics and review monthly. You'll drive yourself nuts otherwise.
Okay so traditional forecasting is solid for spotting trends, but it totally falls apart when weird stuff happens - like, nobody saw 2020 coming, right? That's where scenario planning saves you. Instead of putting all your chips on one prediction, you create 3-4 different futures to explore. Best case, worst case, maybe two realistic middle grounds. It's like having backup plans for your backup plans. You can test your strategies against each scenario and build in some wiggle room. Honestly, it's probably the smartest insurance you'll never think about. Just start with your biggest unknowns and build from there.
So basically, qualitative methods are perfect when you don't have much data to work with or when you need people's gut instincts - like launching something totally new. Super flexible, but yeah, pretty subjective too. Quantitative gives you the hard numbers and works amazing when you've got solid historical patterns. Though honestly, data can totally miss those crazy market shifts that someone with experience might see coming. My take? Combine them. Start with your quantitative baseline, then throw in some qualitative adjustments for the stuff numbers can't capture.
Honestly? I'd say monthly at minimum, but it really comes down to your industry. Tech and retail are crazy volatile - you might need weekly updates when things get hectic. Utilities and stuff like that can probably stretch it to quarterly, though monthly's still better if you can swing it. Don't go overboard though - I've seen people spend more time updating forecasts than actually working on the business, which is kinda backwards. Just pick a schedule that doesn't kill your team and stick with it. Oh, and be ready to throw it all out the window if something major hits the market.
Honestly, seasonal patterns can totally mess up your forecasts if you don't handle them right. Miss those holiday retail spikes? Your predictions will be garbage during peak times. But when you actually model the patterns properly, accuracy shoots up like crazy. Here's the annoying part though - seasons shift over time or get completely wrecked by random stuff (COVID anyone?). I'd grab several years of data and keep tweaking your seasonal adjustments. Also maybe have a backup plan ready because patterns love to change when you least expect it.
So here's the thing - when you get sales, marketing, ops, and finance all talking to each other about forecasts, you actually see what's coming. Sales knows about that big client meeting next month, marketing's got intel on the new campaign launch, ops can warn you about supply issues. It's honestly night and day compared to guessing in the dark. Everyone stops fighting over whose numbers are "right" because you're all working from the same data. Way less drama later too. I'd start with monthly meetings where each team shares what they're seeing - nothing fancy, just get them in a room together.
Honestly, just start with Excel since you probably already have it - handles basic trend stuff fine. Python with pandas is amazing if you don't mind learning some code (totally worth it though). Tableau's solid for making things look pretty, or Power BI if you're already stuck in Microsoft land. R's powerful but kind of a pain to learn at first. There's enterprise stuff like SAS and SPSS but they cost a fortune. My take? Begin with whatever feels comfortable and work your way up. No point jumping into the deep end right away.
Look, forecasting is just predicting what you'll need so you don't order too much or too little stuff. Nobody wants cash tied up in inventory that just sits there, and you definitely don't want angry customers when you're out of stock. I've heard companies slash inventory costs by like 20-30% with decent demand planning - pretty wild honestly. Start with your sales data from the past year or two. Find patterns, check seasonal stuff, see what's predictable first. My old manager used to obsess over this and it actually worked.
Honestly, just be upfront about what your forecasts can and can't do. Don't oversell accuracy to stakeholders - I've watched that backfire spectacularly. When leadership wants to hear certain numbers, resist cherry-picking data that fits their narrative. Always give them uncertainty ranges and different scenarios, especially if decisions affect hiring or layoffs. People's jobs are on the line. Document your methods clearly so others can follow your logic. Oh, and think about ripple effects too - your demand forecasts hit suppliers and whole communities sometimes. Lead with confidence levels right from the start.
-
Easily Understandable slides.
-
Informative design.