


Financial Planning And Analysis Dashboard With Revenue Variance




Try Before you Buy Download Free Sample Product
 Impress Your
 Audience
 100%
100% Editable
 Save Hours
 of Time


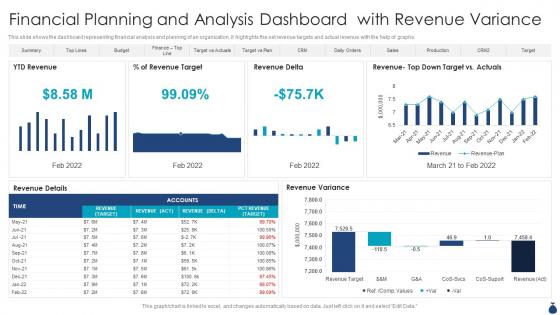
This slide shows the dashboard representing financial analysis and planning of an organization. It highlights the set revenue targets and actual revenue with the help of graphs.
People who downloaded this PowerPoint presentation also viewed the following :
Financial Planning And Analysis Dashboard With Revenue Variance with all 7 slides:
Use our Financial Planning And Analysis Dashboard With Revenue Variance to effectively help you save your valuable time. They are readymade to fit into any presentation structure.





FAQs for Financial Planning And Analysis Dashboard
Cash flow's everything - track your monthly burn rate vs what's coming in. I'd add liquidity ratios and debt-to-income too. Net worth tracking is solid, plus emergency fund coverage (3-6 months is the sweet spot). Investment performance matters obviously. Budget variance analysis sounds boring but it'll save your ass. Don't skip savings rate percentage either. Oh and throw in some projections for big stuff like retirement or house down payment. Honestly, start with these basics then tweak based on whatever financial stuff actually stresses you out.
Honestly, turning your financial data into charts and graphs is a game changer - way better than staring at endless spreadsheet rows. You'll catch trends and weird outliers that would totally fly under the radar otherwise. Like, I've spent hours looking at budget tables and completely missed seasonal patterns that jumped out instantly once I made a simple line chart. Dashboards are clutch too because you can see multiple things at once and zoom in on problem spots fast. Oh, and start with your biggest KPIs first - don't try to visualize everything at once or you'll go crazy.
Don't just copy other companies' dashboards - figure out what YOUR stakeholders actually need first. Pick maybe 5-7 KPIs that people use to make real decisions. Your CFO wants totally different stuff than department heads, so organize by role. Honestly? Most dashboards I see are complete disasters because they try cramming everything in. You want drill-down capability from summary to details, stick with consistent colors, and actually test it with users before launch. Oh and build in review cycles - your business changes and the dashboard should too.
Daily updates are your sweet spot for most dashboards. Real-time is even better if you've got the tech for it. I honestly wouldn't go longer than daily though - weekly feels ancient and people start questioning if your numbers are even current. Cash flow and investment stuff definitely needs more frequent refreshes since those can swing wildly. Monthly reporting? Daily works perfect. Active trading decisions? You really need real-time data. Oh, and definitely automate the updates - manually refreshing spreadsheets all day is soul-crushing. Trust me on that one.
Tableau and Power BI are your best bets - both handle multiple data sources really well and the visualizations look professional. Excel's surprisingly good now for basic dashboards, especially since your team probably knows it already. I've actually been impressed with some Google Sheets dashboards lately, though you're definitely more limited there. Need something web-based for clients? Plotly's solid, or you could go custom with Python if you're feeling ambitious. Honestly though, figure out your data situation and budget first - that'll narrow down your options way faster than anything else.
Honestly, dashboards are game-changers for getting that bird's-eye view of your finances. Instead of drowning in spreadsheets (which, let's be real, nobody enjoys), you can actually see what's happening with your money. Trends become obvious. You'll catch problems early before they spiral. Running "what if" scenarios is super helpful too - like seeing how different strategies might work out over the next few years. My advice? Pick 3-5 key metrics that actually matter to your goals. Don't try tracking everything or you'll just overwhelm yourself with data noise.
You definitely need real-time data for your financial dashboard. Otherwise you're making decisions based on old info, which is pretty much useless. Think of it like using a GPS that still shows Blockbuster locations - not gonna help you much. Live updates on cash flow and expenses help you catch problems early and grab opportunities fast. Connect your dashboard to your bank accounts and accounting software so everything syncs automatically. Trust me, you don't want to waste time manually updating spreadsheets when you could be actually growing your business instead.
Honestly, dashboards are game-changers for money stuff. You can see your cash flow patterns in real-time instead of digging through boring spreadsheets (which I hate doing anyway). When expenses spike unexpectedly or certain budget categories keep failing, it's super obvious right away. Same goes for the good stuff - like when you're crushing your savings goals or have extra room to invest. I'd definitely set up alerts for your most important numbers so it pings you automatically. Way better than manually checking everything constantly. You'll catch problems before they get ugly and spot opportunities you'd totally miss otherwise.
For your financial dashboard, focus on these five things: cash flow, budget variance, savings rate, debt-to-income ratio, and net worth changes. Cash flow's honestly the big one - it shows if you're bleeding money or not. Budget variance catches when you're overspending (we've all been there with takeout). Your savings rate keeps you accountable for actually building wealth instead of just talking about it. Oh, and make sure you can toggle between monthly, quarterly, and yearly views. Different timeframes tell different stories about where your money's really going.
Dude, user feedback is everything when building financial dashboards. Without it, you'll end up with something that looks slick but is totally useless. Ask users what confuses them - maybe those pie charts are too cluttered or they need different spending categories than what you assumed. I've watched so many pretty dashboards completely flop because nobody could actually set up their budget without wanting to throw their laptop out the window. You want to know which features they use every day versus the stuff that's just taking up space. Start getting feedback early and keep tweaking based on how people actually use it.
Don't cram everything onto one screen - you'll just confuse people. Skip the vanity metrics that look cool but don't help anyone make real decisions. Colors are tricky too - I went overboard with rainbow dashboards once and it was a mess. Your data needs to refresh reliably with clear timestamps, because stale financial info is actually dangerous. Oh, and make it work on phones since everyone checks their money on the go these days. Honestly? Start with maybe 3-5 metrics that actually matter to your users, then add more later.
Having your financial stuff on your phone is honestly a game changer. I can check my budget while I'm at Target (dangerous, I know) or log expenses right when I buy something instead of forgetting later. You'll actually stick to your goals way better when tracking is this easy. Your commute becomes productive time for reviewing investments. Set up those push notifications too - bill reminders and spending alerts are lifesavers. Just grab your bank's app and turn on notifications for whatever matters most to you.
Start with your main accounting system - that's where all the P&L and balance sheet stuff lives. Bank accounts are obvious but super important for real-time cash tracking. Your CRM is honestly where the magic happens for forecasting revenue (I can't stress this enough). Payroll and expense tools need to connect too, plus any investment accounts you've got. Oh, and budgeting software if you're using something separate. The whole point is making sure everything talks to each other instead of living in separate bubbles. Otherwise you're just guessing at half your financial picture.
Dude, dashboard layout will literally make or break your financial tool. People bail in minutes if they can't figure out where stuff is. You want navigation that's super intuitive - no hunting around for basic features. Data viz needs to be dead simple too, like your mom could understand it without squinting. Oh, and organize info so it tells their financial story naturally. The really good ones don't even feel designed, they just flow. Honestly though? Get real users testing it ASAP. Watch them fumble around for an hour and you'll fix more problems than your team debating layouts for weeks.
Honestly, start with an audit of who has access to what - you'll probably find tons of people who shouldn't. Multi-factor authentication is absolutely essential, no excuses there. Role-based permissions are key so only the right people see financial data. Encrypt everything, both when it's moving around and when it's stored. Regular security audits will catch problems before they blow up. Oh, and write down clear policies about data access - sounds boring but it matters. The permissions cleanup alone will probably shock you with how messy things get over time.
-
Enough space for editing and adding your own content.
-
Very unique and reliable designs.