


Budget Vs Actual Dashboard For Finance Department




Try Before you Buy Download Free Sample Product
 Impress Your
 Audience
 100%
100% Editable
 Save Hours
 of Time


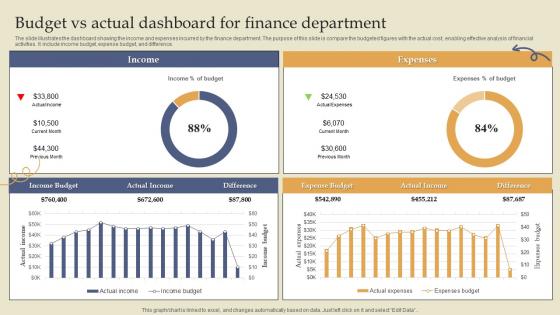
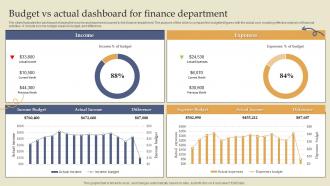
The slide illustrates the dashboard showing the income and expenses incurred by the finance department. The purpose of this slide is compare the budgeted figures with the actual cost, enabling effective analysis of financial activities. It include income budget, expense budget, and difference.
People who downloaded this PowerPoint presentation also viewed the following :
Budget Vs Actual Dashboard For Finance Department with all 7 slides:
Use our Budget Vs Actual Dashboard For Finance Department to effectively help you save your valuable time. They are readymade to fit into any presentation structure.





FAQs for Budget Vs Actual Dashboard
Hey! So for budget vs actual, you'll want to look at three things: the actual dollar differences, percentages (way more useful than just raw numbers), and timing issues. Revenue and expenses behave totally differently - don't lump them together or you'll get confused. I'd set up like a 5-10% threshold so you're not going crazy over every small variance. Year-to-date trends matter more than monthly stuff honestly. Oh and don't forget external factors - sometimes the variance isn't actually about your budgeting skills, it's just weird market conditions or whatever.
Look, variance analysis is basically your reality check - it shows where your money actually went vs. where you thought it would go. Super helpful for catching problems early. Like if your labor costs are way higher than expected or sales are tanking, you'll see it right away. The good variances matter too though (sometimes I think people ignore those). They show what's actually working so you can do more of that. Then you just use all this info to fix your next budget and move money around to where it'll actually make a difference.
Honestly, I'd go with something like Adaptive Insights or Anaplan if you can swing the budget - they're made for this stuff and handle variance analysis automatically. Excel works but gets super messy once you have multiple departments involved (learned that the hard way). Cloud options like Vena are nice because everyone can update their numbers in real time instead of waiting around for month-end. Whatever you pick, make sure it talks to your accounting system or you'll be stuck importing data manually forever. I'd test one department first with a trial before committing to anything big.
Honestly, the worst thing I see is people being super optimistic about money coming in while totally lowballing what they'll actually spend. It's wild how that happens every time. Don't budget alone either - actually talk to your department heads since they know the real costs. Oh, and seasonal stuff always gets forgotten somehow, even though it happens literally every year. Build in like 10-15% extra for random expenses that'll definitely pop up. Trust me on this one - I've seen too many budgets crash and burn because someone thought everything would go perfectly.
Be super transparent - show actual vs budget upfront, then hit the biggest variances first. Don't bury the bad stuff on slide 47 like everyone does! Explain WHY each variance happened and your fix going forward. Charts make everything easier to digest. Oh, and come armed with solutions - nothing's worse than presenting problems without answers. I learned that the hard way last quarter. Stakeholders want to see you've thought through next steps, not just identified what went wrong.
Think of forecasting as your budget's best friend - it predicts future revenue and expenses using past data and market trends. These predictions become your foundation for setting realistic targets and dividing up resources. Honestly, without solid forecasts you're just throwing darts blindfolded. Throughout the year, keep updating your forecasts so you can compare actual results against both your original budget and newer predictions. Oh, and definitely check how accurate last year's forecasts were first - you'll catch patterns that'll make this year's budgeting way smoother.
Look, monthly reviews are the bare minimum, but I've found quarterly works way better for most businesses. Gives you actual trends instead of chasing random monthly weirdness. Daily or weekly? That'll make you nuts - trust me on this one. You'll be freaking out over every tiny variance that doesn't even matter. Start monthly and see how it feels. If your business is pretty steady, stretch it to quarterly. Super volatile industry? Maybe stick with monthly. The goal is catching problems early without becoming a spreadsheet zombie who overreacts to normal ups and downs.
Honestly, start with solid baseline data and update it constantly. Rolling forecasts beat static annual budgets every time. Get your department heads involved - they actually know what's happening with their numbers. Look at your historical trends, especially seasonal stuff and what caused variances before. Monthly breakdowns work way better than quarterly ones for spotting problems early. Document your assumptions so you can pivot when things change (and they will). Set up monthly reviews with actual action plans, not reports that just collect digital dust.
Honestly, charts and graphs are game-changers for budget stuff. People can spot the problems right away instead of staring at boring spreadsheet rows forever. Waterfall charts are my go-to - they literally show you where everything went sideways. Use colors too: red for over budget, green for under. Dashboard layouts work best since executives hate scrolling through tables (who has time for that?). Just highlight your biggest variances first, then let people dig deeper if they want. Trust me, it's so much easier than trying to explain numbers in a meeting.
Look at variance percentage, absolute dollar amounts, and trends over time - those are your big three. A 5% variance means nothing on a $10K budget but it'll wreck you on $1M. Rolling 3-month trends are where I focus since random stuff happens monthly, but patterns? That's what actually matters. Oh, and set materiality thresholds upfront so you're not wasting time on $50 variances when there's real money issues to tackle. Trust me on this one.
Honestly, external stuff like inflation or supply chain chaos will mess up your budget analysis way more than internal issues. Build in a 5-10% buffer from the start - learned that the hard way. Track external hits separately so you're not blaming your team for things they couldn't control. I keep a running note of what external factors screwed us over each period. Makes explaining variances so much easier when leadership asks questions. Oh, and do quarterly reviews to catch this stuff early. Short sentences help. The goal is separating what you could've prevented from genuine outside forces.
So here's what works - catch those variances early before they blow up on you. Focus on the big ones first since that's where you'll actually move the needle. Most budget issues I've dealt with? Either people were way too optimistic upfront or they didn't update their assumptions when reality hit. Rolling forecasts are a game changer, plus monthly check-ins with department heads keep everyone honest. The thing is, don't just sit there analyzing spreadsheets all day. Actually do something about it - tweak your operations or fix your targets based on what the numbers are telling you. Having backup plans ready doesn't hurt either.
Look, don't get bogged down in every tiny expense when you're already swamped. Hit the big stuff first - revenue, payroll, maybe your top 3-4 spending categories. I used to obsess over every line item and it was honestly a huge waste of time. Just grab a basic spreadsheet or something like QuickBooks to track planned vs actual. Monthly check-ins work fine - if anything's off by 10-15% or more, then you dig deeper. That's really it. You'll catch the stuff that actually threatens your cash flow without going crazy over office supplies or whatever.
So zero-based budgets make you start fresh every time - justify each expense instead of just tweaking last year's numbers. Way more work, not gonna sugarcoat that. But here's the thing: you'll spot all that wasteful spending that gets hidden under "we've always done this." Every dollar gets questioned, which honestly feels excessive at first but your reports become so much clearer. You can actually see what's worth the money vs. what's just dead weight. I'd test it on one department first though - diving in company-wide seems brutal.
Looking at your budget vs actual trends over a few years is honestly a game-changer. You'll catch patterns you'd never notice otherwise - like how marketing always goes nuts in Q4 or whatever. Pull maybe 2-3 years of monthly data and scan for the obvious stuff first. Once you see where departments consistently blow their budgets or lowball everything, your forecasting gets so much better. No more getting blindsided by the same seasonal spikes every year. Some teams are just terrible at estimating their needs (you know which ones), but the data doesn't lie. Way better than flying blind each budget cycle.
-
The customer care of SlideTeam is very responsive. I was having a payment issue and they fixed it for me in no time.
-
Kudos to SlideTeam for achieving the high success rate in delivering the top-notch slides.