


Tracking Project Budget Cost And Expense Dashboard




Try Before you Buy Download Free Sample Product
 Impress Your
 Audience
 100%
100% Editable
 Save Hours
 of Time


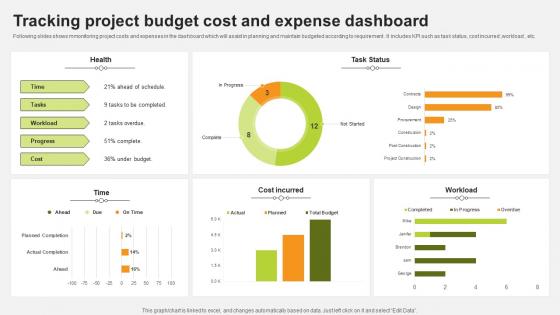
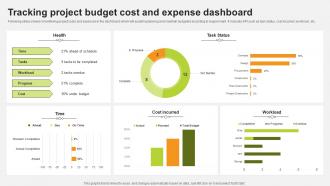
Following slides shows mmonitoring project costs and expenses in the dashboard which will assist in planning and maintain budgeted according to requirement . It includes KPI such as task status, cost incurred ,workload, etc.
People who downloaded this PowerPoint presentation also viewed the following :
Tracking Project Budget Cost And Expense Dashboard with all 7 slides:
Use our Tracking Project Budget Cost And Expense Dashboard to effectively help you save your valuable time. They are readymade to fit into any presentation structure.





FAQs for Tracking Project Budget Cost
Budget vs actual should be right up top - that's what everyone cares about most. Throw in your burn rate and what you think final costs will hit. Those red/green status lights are clutch because honestly, who has time to decode spreadsheets? Break down remaining budget by category and show variance analysis so people can see where you're bleeding money. Timeline view helps spot weird spending spikes too. I'd add milestone forecasts if you're tracking those. Bottom line - if someone can't figure out your budget health in like 10 seconds, you've made it too complicated.
Dude, charts totally saved my sanity during budget reviews. Instead of drowning in spreadsheet hell, you can actually SEE what's happening. Bar charts work great for comparing what you planned vs what you actually spent. Heat maps will show you problem areas right away - like boom, there's your overspend in red. I'm obsessed with burn-down charts now because they show your spending pace over time. The trick is matching the right visual to whatever question people keep bugging you about. Start simple with a basic dashboard template, then just add charts as you figure out what actually matters to your team.
Honestly, focus on budget variance first - just actual vs what you planned. Burn rate's crucial too. I always set alerts at 75% so there's time to pivot instead of panicking at 95%. Cost performance index tells you if you're actually getting value, which is huge. Timeline impact matters since budget issues usually screw with deadlines anyway. Oh, and earned value can be useful but some teams think it's way too much overhead - depends on your situation really. That early warning system at 75% has saved my butt more times than I can count.
Honestly, weekly updates are the sweet spot for most projects - gives you enough heads up without drowning in admin work. Daily is better if you're dealing with tight budgets or things are moving super fast. I got burned once doing quarterly updates and had to explain budget issues from like 3 months ago... not fun. The whole point is catching problems while you can still do something about it. If you're in a critical phase or burning through cash daily, definitely go more frequent. Really depends on your project's pace, but weekly keeps most people sane.
Honestly, most people still use Excel because it's what everyone already knows how to use. Power BI is solid if you're in a Microsoft shop - connects to everything seamlessly. Tableau's got the prettiest charts but costs more. Google Sheets works great for team stuff since it's all cloud-based. My advice? Don't overthink it. Start with whatever your team won't grumble about learning. I've seen too many beautiful Tableau dashboards that nobody actually opens because Susan from accounting refuses to log into another platform. Better to have something basic that people check daily than a masterpiece gathering digital dust.
Honestly, having a budget dashboard is a game changer. Everyone can see spending in real-time instead of guessing what's happening. You'll catch overruns early - way better than finding out when it's too late to do anything about it. Plus you can move money around when priorities shift (which they always do). The visual aspect makes it so much easier for stakeholders to actually get what's going on without digging through spreadsheets. Set up alerts for the big milestones so you're not glued to it 24/7. Those tough budget conversations become way less painful when you have the data right there.
Okay so first thing - figure out who's responsible for updating what and when. Otherwise it's chaos. Set up some automated checks to catch dumb mistakes like negative budgets or expenses that go over your limits. Seriously, I've watched perfectly good dashboards turn into paperweights because nobody trusts the data anymore. You'll want to reconcile with accounting weekly if possible. Oh and build in some kind of audit trail so when numbers change (and they will), you can actually figure out why. The whole point is making data entry pretty much idiot-proof and catching problems before your boss sees them.
Honestly, just figure out what your specific project actually needs to track first. Construction? Focus on materials and labor hours. Software stuff needs resource allocation and sprint budgets instead. Most dashboard tools are pretty drag-and-drop friendly these days, which is nice. You can set different permission levels too - stakeholders only see what's relevant to them. I'd start by identifying your unique cost drivers, then build around those. The widgets thing might seem overwhelming at first, but you'll get the hang of it once you start moving things around.
Honestly, the data integration part is what'll kill you. Getting clean feeds from finance systems, project tools, timesheets - it's a nightmare. I spent like 3 weeks just fixing data inconsistencies once. Executive sponsors want these pretty high-level dashboards while team leads need every cost detail broken down. Scope changes constantly wreck your baselines too, which is super annoying. My advice? Start with maybe 3-4 key metrics max. Get that pipeline solid first. Don't try to build some fancy comprehensive thing right away - you'll just end up drowning in spreadsheets instead of actually analyzing anything useful.
Honestly, just grab data from your old projects and dump it into your dashboard for comparison. Most tools let you upload CSVs or connect straight to your project database - super easy. I always do separate series for last year's similar stuff, budget vs actual, seasonal patterns, whatever. Makes spotting weird trends so much clearer. Side-by-side charts work great - current spend next to historical averages with some variance flags when things get wonky. Oh, and don't go crazy with comparisons. Pick your three best matching past projects as benchmarks and you're golden.
Honestly, budget dashboards are game-changers for catching problems early. Real-time spending data shows you exactly when categories start burning cash too fast - usually means scope creep or someone's hogging resources. Way easier than hunting through spreadsheets every Friday (ugh). The visual stuff makes overruns super obvious before they wreck your project. Set alerts at 75% and 90% so you're not scrambling last minute. I learned this the hard way on my last big project - those automated warnings actually saved my butt when marketing went crazy with vendor spending.
Color coding is seriously a game changer for budgets - red for overspending, green when you're good, yellow for getting close to limits. Makes everything so much easier to scan. I'd also throw in some progress bars to show where you're at budget-wise. Keep your fonts consistent and don't cram everything together, white space actually helps a ton. Oh and maybe start with color-coding whatever's stressing you out most? Like if you always blow your dining budget, flag that first. The whole point is spotting problems instantly instead of digging through spreadsheet hell.
Honestly, stakeholder feedback is what makes or breaks a dashboard. Without it, you're just guessing at what people need. They'll tell you which metrics actually matter to their daily work and which charts make zero sense. I've seen too many dashboards that look pretty but nobody uses them because they miss the mark completely. Get their input on layouts, priorities, and pain points – then iterate based on how they're actually using it. Start simple, then build up. When people help shape it, they're way more invested in making it work.
Dude, you need to check that budget dashboard weekly - it's basically your financial GPS. When scope creep hits (and it will), you'll catch it before it destroys everything. The visual stuff makes it super easy to see if you're burning cash too fast to hit deadlines. Plus when stakeholders start asking for random changes, boom - you can show them exactly what it'll cost. Honestly saved my ass so many times. Makes those trade-offs between cool features and staying on budget way clearer. Real-time tracking beats spreadsheet hell any day.
Dude, automation is a total game-changer for budget dashboards. Real-time updates mean no more pulling numbers from like 5 different spreadsheets every week. Those automated alerts? They'll catch you before you blow past budget limits – seriously saved me so many awkward conversations with my boss. Manual data entry is where most mistakes happen anyway, so cutting that out makes everything way more accurate. Your team gets current info instead of last week's numbers. I'd start with whatever data source eats up most of your time first. Trust me on this one.
-
Editable, diversified, compatible with MS PPT and Google Slides, and on top of that finest graphics!! I mean in the words of the famous Ross Geller, “What more do you want!”
-
No second thoughts when I’m looking for excellent templates. SlideTeam is definitely my go-to website for well-designed slides.