

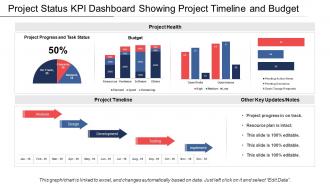
Project status kpi dashboard showing project timeline and budget






Try Before you Buy Download Free Sample Product
 Impress Your
Audience
 100%
Editable
 Save Hours
of Time


Increase the extent of your accomplishments with our Project Status Kpi Dashboard Showing Project Timeline And Budget. Continue to add to the feathers in your cap.
People who downloaded this PowerPoint presentation also viewed the following :
Project status kpi dashboard showing project timeline and budget with all 6 slides:
Our Project Status Kpi Dashboard Showing Project Timeline And Budget are extremely compatible. They adjust to cultures across the globe.


FAQs for Project status kpi dashboard showing project
Definitely include timeline/milestones and budget tracking - those are non-negotiables. Task progress and team workload are critical too. I can't tell you how many times I've watched projects crash because someone was drowning and nobody knew it. Resource allocation should be front and center. Risk indicators matter, along with KPIs you can actually read quickly. Oh, and don't skip stakeholder communication logs or deliverable status. The whole point is telling your project's story without making people hunt through five different apps. Just don't go overboard cramming every metric imaginable on there.
Honestly, data visualization is a game changer for projects. Your brain just processes visuals way faster than staring at endless spreadsheet rows. Charts and graphs make bottlenecks super obvious - you'll spot where things are stuck or which tasks are blocking others without digging through data. I always tell people to start with a basic dashboard showing your key metrics. Progress tracking becomes so much easier when you can see everything at a glance. Plus you can quickly tell if resources are getting stretched too thin. Way better than the old spreadsheet hunt, trust me.
Your KPIs are basically the boss of your dashboard - they decide what gets the spotlight and how everything looks. So if budget variance is crucial for your project, put that chart right up front where everyone can see it. The less important stuff? Tuck it away in tabs or smaller corners. Honestly, you've gotta be pretty ruthless about what actually matters to whoever's using this thing. I'd start with your top 5 KPIs and build the whole layout around those. Don't overcomplicate it - just focus on what people really need to see first.
Honestly, Monday.com is probably where I'd start - their dashboard setup is super straightforward and you can drag stuff around easily. Asana's pretty solid too for customization. Oh, and Notion is weirdly good at this if your team doesn't mind figuring it out first (took me forever to get the hang of it). Smartsheet's more like Excel but actually looks decent when you're done. Just grab Monday's free trial first since it's the most beginner-friendly, then you can always check out the others if it's not hitting what you need.
Honestly, it's a game changer - your team finally has one spot to see everything instead of digging through Slack threads and random emails. Real-time progress tracking means way fewer "where are we on this?" interruptions. Well, fewer anyway. Everyone stays on the same page about what matters most, and you can catch problems early before they blow up. Your stakeholders can actually check stuff themselves instead of bugging you for updates every day. Just dump all your current project info into one dashboard first. You'll be shocked how much smoother everything runs after that.
Honestly, automated syncing is what'll save you the most headache. Hook your dashboard straight into Jira, Asana, whatever you're already using so data updates instantly. Manual entry is where everything goes wrong - people forget or just don't bother. Set up some validation rules too so bad data gets caught early. Have team leads do quick audits periodically to double-check their stuff. The whole point is cutting out as many manual steps as possible because humans are terrible at remembering boring admin tasks. I'd start with your most important metrics first, then expand from there.
Honestly, just make different views for different people. Execs want the big picture stuff - budget, timelines, that kind of thing. Your team needs the nitty-gritty task details and who's doing what. Clients? They just want milestones and deliverables - trust me, they don't care about your sprint chaos. Set up role permissions so people only see what matters to them. Oh, and customizable widgets are clutch for this. Best approach is asking each group what decisions they're actually making, then build dashboards around that. Way less overwhelming for everyone.
Don't cram every metric onto one screen - it's like information overload. Pick 5-7 KPIs that actually matter to your audience. Honestly, I've seen dashboards that look like someone threw data at a wall. Keep fonts readable and layouts clean. Nobody wants to squint at tiny numbers all day. Your data needs to refresh often enough to be useful, not outdated by the time someone looks at it. Always add context like targets or benchmarks - raw numbers don't tell the story. Start simple and only get fancy when people ask for it.
Honestly, dashboards are game-changers for catching problems early. Instead of digging through a million spreadsheets (seriously, who has time?), you'll see everything in one spot - budget issues, missed deadlines, resource crunches. The visual setup makes it way easier to spot weird patterns before they become disasters. Set up alerts so your team gets pinged when things go sideways. I'd start with your biggest 3-5 problem areas and build widgets around those. Check them daily and you'll actually stay ahead of the chaos for once.
Gantt charts are perfect for timelines, and burndown charts will show you progress at a glance. Bar or pie charts work well for budget stuff. Those red/yellow/green status dots? Honestly such a lifesaver for quick health checks. If you're doing agile, Kanban boards are clutch. Milestone trackers help stakeholders see the big picture without drowning in details - though half of them still won't read it anyway. Your brain processes visuals way faster than number tables. Start with maybe 3-4 key charts that answer your most common questions, then build from there.
Honestly, dashboards are a game-changer for agile teams. You'll see your sprint progress, backlog status, and team velocity all in one place instead of waiting for standups to hear about problems. Real-time burndown charts and story point tracking? Chef's kiss. Set up widgets for sprint progress and upcoming deadlines - your stakeholders will stop pinging you constantly because they can just check themselves. Oh, and definitely connect it to your existing tools so it updates automatically. Nobody has time to manually input data all day. The visibility alone makes it worth the setup hassle.
Dude, honestly it's a lifesaver. You can check project updates from literally anywhere - coffee shop, client meetings, even waiting in line somewhere random. No more being stuck at your desk to approve stuff or respond to your team. The biggest win? Projects don't get bottlenecked when you're out of office. Your team stays moving, deadlines don't get missed, and you're not scrambling on weekends to catch up on things. Work-life balance actually becomes real. Oh and definitely look for ones that work offline - trust me on that one.
Honestly, just start asking your users what's bugging them - the active ones especially know where the pain points are. Set up some casual check-ins or quick surveys since most people won't complain unless you directly ask. Maybe add a simple way for them to report bugs too. I'd track which features actually get used vs. the ones everyone ignores (that data's pretty telling). Don't wait around for some massive redesign though. Small tweaks based on what multiple people are requesting works way better. Oh, and usage analytics are your friend here - they'll show you what's really happening vs. what people say they want.
So honestly, focus on schedule variance (are you hitting deadlines?), budget variance, and how much of your scope you've actually finished. Team velocity is clutch too - saved me last month when we caught a resource crunch before it got ugly. Don't sleep on quality stuff like defect rates if you're building something real. But here's the thing - pick maybe 5-7 metrics tops that actually matter for YOUR project. Nobody wants to drown in spreadsheets. Set up some automated alerts so you're not the last person to know when things go sideways.
So basically, when you hook up your dashboard to stuff like Slack, GitHub, or whatever CRM you're using, it becomes this central command center instead of just another random tool. All your data starts flowing in automatically - no more playing data entry monkey with manual updates. Code deployments, budget stuff, team chats, project status... it all lives in one spot now. Honestly, the time you'll save not jumping between fifteen different apps is insane. My advice? Start with the tools you're already glued to all day - that's where you'll actually notice the difference right away.
-
Professional and unique presentations.
-
Really like the color and design of the presentation.