


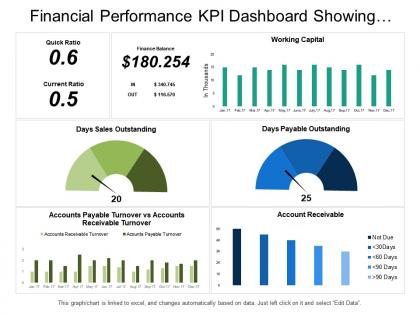
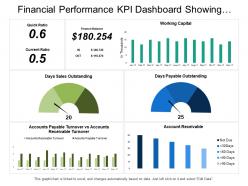
Financial performance kpi dashboard showing quick ratio current ratio working capital




Try Before you Buy Download Free Sample Product
 Impress Your
 Audience
 100%
100% Editable
 Save Hours
 of Time


Earn and deserve all the appreciation with our Financial Performance Kpi Dashboard Showing Quick Ratio Current Ratio Working Capital. Claim and get what is due to you.
People who downloaded this PowerPoint presentation also viewed the following :
Financial performance kpi dashboard showing quick ratio current ratio working capital with all 6 slides:
Explore the future with fair accuracy due to our Financial Performance Kpi Dashboard Showing Quick Ratio Current Ratio Working Capital. You will display great insight.



FAQs for Financial performance kpi dashboard showing quick ratio current
So financial KPIs are basically the scoreboard - revenue, profit margins, whether you're actually making money. Operational ones track the stuff that makes those numbers happen. Like customer satisfaction, how efficient your team is, turnover rates. Here's the thing though - operational metrics give you a heads up about future performance. Financial ones just tell you what already went down. You really need both to figure out what's working. If your operational KPIs look solid but financials are trash, something's off in your strategy (or timing). Makes sense?
Look, KPIs are basically your financial GPS - they show what's actually making money vs. what's draining it. Super helpful for deciding where to spend next. Like if your customer acquisition costs are going crazy but lifetime value isn't budging? Time to completely rework your marketing approach. Revenue trends also tell you whether it's smart to expand or just stay put for now. I've watched way too many companies tank because they ignored their numbers and just went with whatever "felt right." The trick is finding the right metrics for your goals, then actually doing something about what they're telling you.
Honestly, if you're just starting out, obsess over burn rate and runway first - like how many months before you're broke? MRR is huge too since you need to prove you're growing fast enough. Customer acquisition cost vs lifetime value will save your ass once you figure out if your business model actually works. Once you've got steady cash flow, then you can worry about the fancy stuff like ROI and EBITDA margins. Working capital ratios matter more when you're not constantly fundraising. Start simple with the survival metrics, then add the profitability ones later.
Start with figuring out which metrics actually matter for your industry - stuff like revenue per employee or debt ratios. IBISWorld has decent industry reports, or you can dig through public company filings if that's relevant. Bloomberg's amazing but costs a fortune (honestly might be worth it though). The key thing is comparing yourself to similar companies - don't stack a tech startup against some massive manufacturer, you know? Look at percentiles instead of just averages so you get the real picture. I'd check in quarterly to see how you're tracking against those benchmarks.
Honestly, cash flow metrics are way better than regular profit numbers because you're seeing actual money moving around - not just accounting magic on spreadsheets. I'd focus on operating cash flow first (shows if your business actually makes real money), then free cash flow so you know what's left for paying down debt or expanding. Cash flow margin's pretty useful too for comparing different time periods. The cool thing is it's harder to fake than earnings - companies can't really play games with actual cash. Track maybe 2-3 ratios monthly instead of obsessing over every quarter. Way more telling than those flashy revenue numbers everyone talks about.
Look, investors basically want one thing - proof you can actually turn a profit. Net profit margins are like your report card for that. Strong, steady margins? You're golden. Shows you've got control over pricing and costs. But here's the thing - if those numbers start slipping, investors get jumpy fast. They'll either bail or your stock takes a hit. Honestly, I've seen it happen too many times. My advice? Check your margins every quarter and have a solid explanation ready if they dip. Don't just shrug it off - have an actual plan to fix whatever's going wrong.
ROI is your go-to metric for figuring out if your investments are actually worth it. Just divide your net profit by what you initially spent - boom, you've got your percentage return. Super simple but crazy useful for comparing different projects. Honestly, I use it way more than I thought I would when I first learned about it. Don't rely on ROI alone though - pair it with stuff like payback period to get the whole picture. Once you start tracking it on your big initiatives, you'll see which ones are killing it and deserve more cash.
Honestly, start with your data sources - make sure they're actually clean and reliable before you build anything on top. Automate collection wherever you can because manual entry is where everything goes to hell (I've witnessed some truly tragic spreadsheet situations). Monthly reconciliations are your friend - cross-check your KPI reports against your ERP or accounting systems. Document your calculation methods clearly so everyone's on the same page. Don't wait until the end to catch problems - build in checkpoints throughout the whole process. Maybe audit what you've got right now this quarter?
Keep your charts super simple - bar charts for comparing stuff, line graphs for trends. Seriously, cluttered slides make everyone's eyes glaze over. Pick consistent colors (red = bad, green = good) and always throw in some context like last year's numbers or your targets. Otherwise people have no clue if 47% is amazing or terrible, you know? Start with your big takeaway first, then back it up with data. Oh, and definitely test your charts on a coworker beforehand - if they're squinting or asking "wait, what?" then you need to simplify. Less really is more with this stuff.
Oh man, seasonality will mess with your head if you're not watching for it. Compare year-over-year instead of month-to-month - retail always explodes in Q4, B2B software dies in summer, that kind of thing. Market trends are trickier though. Economic shifts or industry stuff can make your numbers look amazing when really the whole market just grew. I totally fell for that once and thought we were killing it! Rolling averages help smooth things out. Also peek at what competitors are doing - sometimes your "bad" quarter is actually pretty solid given what everyone else dealt with.
Honestly, Excel's still pretty solid for most finance teams - yeah I know it's old school but it just works. Tableau and Power BI are obvious choices if you want fancy dashboards. Your ERP probably does way more reporting than you realize too (we barely scratched the surface with ours for like two years). QuickSight's decent, or go simple with Google Data Studio. Adaptive Insights and Anaplan are more heavy-duty options. Real talk though - pick whatever your team will actually stick with. I've seen too many companies blow money on tools that just collect dust. Start with something that plays nice with your current setup first.
Look, financial numbers only show you what already went down. You want the stuff that predicts what's coming next - like customer satisfaction or how many people are jumping ship from your team. Those metrics give you the heads up before your revenue takes a hit. Happy customers stick around and spend more, but by the time that shows up in your financials, you've already missed other opportunities (or problems). Pick maybe 2-3 non-financial things that actually drive your sales. Track those alongside your usual money stuff and you'll start seeing patterns way earlier.
Don't go crazy with too many KPIs - you'll just confuse everyone. Pick 3-5 that actually matter to your goals, not the flashy vanity stuff that looks cool in presentations. Revenue growth is nice, but what about profit margins? Mix some forward-looking metrics with the backward ones (your CFO probably loves those historical numbers). Make sure your team can actually do something about the KPIs you choose - otherwise what's the point? I'd test whatever you pick for a quarter first. Honestly, most people overthink this whole thing.
Quarterly reviews are the minimum, but I'd honestly check monthly if possible. Things move so fast these days - what worked six months ago could be completely useless now. Market shifts, strategy changes, new competitors... it all affects which metrics actually tell you something useful. For the deeper quarterly review, get your whole team involved. The key question is simple: do these KPIs still match what we're trying to achieve? I learned this the hard way when we kept tracking vanity metrics way too long. If they don't align anymore, time to switch up what you're measuring.
Oh man, this stuff gets messy fast. IFRS and GAAP handle things totally differently - your debt ratios could look way worse under one system versus another. Revenue recognition rules? Completely different timing depending where you are. Asset valuations too. Honestly it's kind of annoying when you're trying to compare subsidiaries across countries because nothing matches up cleanly. ROA calculations won't mean the same thing in Europe vs the US. Just stay consistent within whatever framework you're using and always tell people which standards you followed. Otherwise you'll be explaining weird discrepancies in meetings forever.
-
Unique design & color.
-
Unique research projects to present in meeting.