


Working Capital Dashboard To Evaluate Finance Metrics





Try Before you Buy Download Free Sample Product
 Impress Your
 Audience
 100%
100% Editable
 Save Hours
 of Time


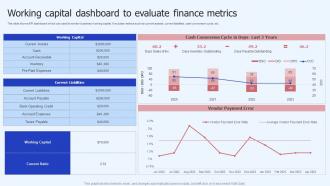
This slide shows KPI dashboard which can used to monitor business working capital. It includes metrics such as current assets, current liabilities, cash conversion cycle, etc.
People who downloaded this PowerPoint presentation also viewed the following :
Working Capital Dashboard To Evaluate Finance Metrics with all 7 slides:
Use our Working Capital Dashboard To Evaluate Finance Metrics to effectively help you save your valuable time. They are readymade to fit into any presentation structure.





FAQs for Working Capital Dashboard To
A working capital dashboard should include cash conversion cycle, days sales outstanding, days payable outstanding, inventory turnover ratios, and current ratio metrics. These financial indicators streamline liquidity management by tracking cash flow timing, supplier payment optimization, and inventory efficiency, with many CFOs finding that real-time visibility into these metrics enables faster decision-making and improved cash positioning.
Visualizations enhance working capital understanding by transforming complex financial data into clear charts, graphs, and trend analyses that reveal cash flow patterns, inventory turnover rates, and receivables performance at a glance. Through interactive dashboards, finance teams can quickly identify bottlenecks, monitor seasonal fluctuations, and track key metrics, ultimately enabling faster decision-making and more strategic resource allocation across operations.
The current ratio measures a company's ability to pay short-term obligations using current assets, serving as a key liquidity indicator in working capital dashboards. This metric enables financial managers to assess operational health, optimize cash flow management, and make strategic decisions about inventory levels and payment terms, with many organizations finding that maintaining optimal current ratios enhances creditworthiness and operational flexibility.
Businesses can effectively track accounts receivable turnover by displaying current ratio calculations, aging analysis breakdowns, payment trend comparisons, and collection efficiency metrics on their dashboard. Through real-time visualization tools, organizations monitor cash flow patterns, identify slow-paying customers, and optimize collection strategies, with many financial teams finding that automated tracking significantly improves working capital management.
A working capital dashboard enhances cash flow forecasting by providing real-time visibility into receivables, payables, inventory levels, and payment cycles, enabling accurate predictions of future cash positions. Through automated data integration and trend analysis, financial teams can identify seasonal patterns, anticipate cash shortfalls, and optimize payment timing, ultimately delivering improved liquidity management and strategic financial planning.
Inventory management directly influences working capital dashboard metrics by affecting inventory turnover ratios, days inventory outstanding, and cash conversion cycles. Efficient inventory control reduces carrying costs, minimizes obsolescence risks, and accelerates cash flow, with retailers and manufacturers finding that optimized stock levels improve liquidity ratios and overall working capital efficiency.
Seasonality significantly impacts working capital patterns, with businesses experiencing predictable fluctuations in inventory levels, accounts receivable, and cash flow based on seasonal demand cycles. Retail companies typically build inventory before holiday seasons while agricultural businesses see working capital swings during harvest periods, making year-over-year comparisons and seasonal trend analysis essential for accurate financial interpretation.
Trends in working capital can be effectively communicated through visual dashboards featuring clear graphs and charts, executive summaries highlighting key metrics, regular stakeholder reports with actionable insights, and comparative analysis showing performance against benchmarks. These communication methods enable finance teams to present complex cash flow patterns, inventory cycles, and payment trends in digestible formats, while facilitating informed decision-making across departments and ultimately enhancing organizational financial transparency.
Common pitfalls include overloading dashboards with excessive metrics, using static data that lacks real-time insights, poor visualization choices that obscure trends, and failing to customize views for different stakeholder needs. Many organizations find that focusing on too many KPIs simultaneously reduces effectiveness, while neglecting mobile optimization and user training ultimately diminishes adoption and strategic decision-making capabilities.
Automation improves working capital dashboard accuracy by eliminating manual data entry errors, ensuring real-time synchronization across financial systems, and standardizing data collection processes. Through automated integration with ERP systems, banks and manufacturing companies achieve consistent cash flow reporting, reduce reconciliation discrepancies, and ultimately deliver more reliable financial insights for strategic decision-making.
Key working capital benchmarks include current ratio (1.2-2.0), quick ratio (0.5-1.0), days sales outstanding (30-45 days), days payable outstanding (30-60 days), and inventory turnover ratios varying by sector. Manufacturing companies typically maintain higher inventory levels than service businesses, while retail organizations focus on seasonal turnover patterns, with many finding that industry-specific comparisons deliver more actionable insights than generic benchmarks.
A working capital dashboard facilitates scenario analysis by enabling real-time modeling of different cash flow assumptions, payment terms adjustments, and inventory level changes through interactive visualizations and predictive analytics. These tools allow finance teams to simulate various business conditions, compare multiple optimization strategies simultaneously, and assess potential impacts on liquidity ratios, ultimately delivering data-driven insights for strategic decision-making.
Effective working capital dashboard tools include Microsoft Power BI, Tableau, Oracle NetSuite, SAP Analytics Cloud, and QuickBooks Advanced Reporting. These platforms streamline financial monitoring by automating data integration, providing real-time cash flow visibility, and generating customizable KPI reports, with many finance teams finding that cloud-based solutions deliver faster insights and enhanced decision-making capabilities.
Businesses measure working capital efficiency through KPIs including cash conversion cycle, days sales outstanding, inventory turnover ratio, days payable outstanding, and current ratio. These metrics enable organizations to track cash flow velocity, optimize payment cycles, and minimize tied-up capital, with many companies finding that monitoring these indicators delivers improved liquidity, reduced financing costs, and enhanced operational performance.
Best practices for maintaining a working capital dashboard include establishing automated data feeds, scheduling regular review cycles, implementing real-time monitoring alerts, standardizing calculation methodologies, and conducting monthly accuracy audits. These practices streamline financial oversight by ensuring data integrity, enabling proactive cash flow management, and delivering consistent reporting standards, with many organizations finding that automated updates reduce manual errors while enhancing strategic decision-making capabilities.
-
I was confident and well prepared for my presentation for the first time ever. With SlideTeam’s templates, I could deliver one of my best presentations. Will be coming back for more!
-
Impressive templates. Designing a presentation is fun now!