Amazon, the e-commerce behemoth, updates its prices on its website up to 2.5 million times a day. Thanks to ‘Data,’ which is regarded as the ‘new oil’ in today’s business world. Data provides businesses with knowledge to use in corporate decision-making and planning. Brands such as Netflix, GE, Mariott, Uber, and others leverage data to identify new business opportunities that increase revenue and offer a better consumer experience.
Data analysis helps organizations navigate the intricacies of today’s marketplace. Click here to access Data Analysis Templates to recognize trends and gain insights that pave the way for strategic decision-making.
Data expansion is exponential. Google processes over 40,000 queries every second, or 3.5 billion daily searches. The search engine market leader is believed to process over 20 petabytes of data per day.
Executive Project Status Report Templates are significant assets for businesses. Use SlideTeam’s PPT Templates to provide information to your executives in an eye-catching and innovative way, highlight concerns, and expedite project progress communication.
Businesses acknowledge the need for data analysis and use data summaries to optimize operations, drive traffic, promote innovation, and generate revenue.
Data Summary: Transform data into information.
It is a simplified representation of data that allows you to see its critical elements. Portraying data/information in numbers or visually to understand values involved is always a beneficial strategy.
This blog goes into data summary and its samples to help you see correlations between what is happening across locations, departments, and systems. It will help you grasp data, regardless of its size. Use SlideTeam’s Top 10 Data Summary Templates to organize and evaluate complex data for valuable insights. These templates are excellent for comparing current and previous data to provide perspective and harness findings. The 100% customizable nature of the templates allows you to edit your presentations. The content-ready slides give you the much-needed structure.
Use SlideTeam’s top-notch PPT Templates to clean and turn all corporate data into a uniform format to reveal subtle trends and information that would otherwise have gone unnoticed.
Continue reading to find facts and significant trends in the data.
Template 1: Data Summary PPT
A data summary is a useful data management tool for summarizing a set of observations. This PPT Deck helps you condense data research to deliver power-packed information as simply as feasible. This complete set of slides contains a sample format for displaying statistical data connected to elements within the business. This presentation includes a data summary for gender comparison, competitive analysis, group comparison, departments, etc. Use this template to depict data summaries related to business growth. Download it now!
Template 2: One-Pager Data Migration Project Executive Summary PPT
Data migrations are often the outcome of the launch of a new system. This one-page data report provides an executive summary of a data migration project to modernize the database and build a new data warehouse. It includes the project’s name, sponsor, money allocation, spending analysis, challenges, drivers, etc. Use this presentation to propose a method for prioritizing difficult migrations based on business priorities and implementation complexity. This is the base of any organization’s vitality and a solid base of priceless intellectual property. Get it right away!
Template 3: Data and Analytics Impact Summary on Business PPT
Data impact analysis helps an organization optimize its performance, function more efficiently, maximize profit, or make strategic decisions. This PowerPoint Presentation helps discuss the possible impact of data and analytics on location-based services and other industries. It also involves significant adoption hurdles that stymie the process. This slide will help you understand the benefits and drawbacks of any changes. Use this presentation resource to streamline procedures and raise the efficiency of a system or business. Save it now!
Template 4: Application Data Migration Summary Dashboard Snapshot PPT
Use this PPT Template to track the migration of application data from one server to another. This presentation depicts the dashboard snapshot of an application data migration summary to provide information about recently updated applications, applications by migration status, migrated applications over time, etc. This will allow enterprises to preserve data integrity and quality. Use this presentation resource to gain a snapshot of data transmitted across its types, databases, and storage systems. Get it now!
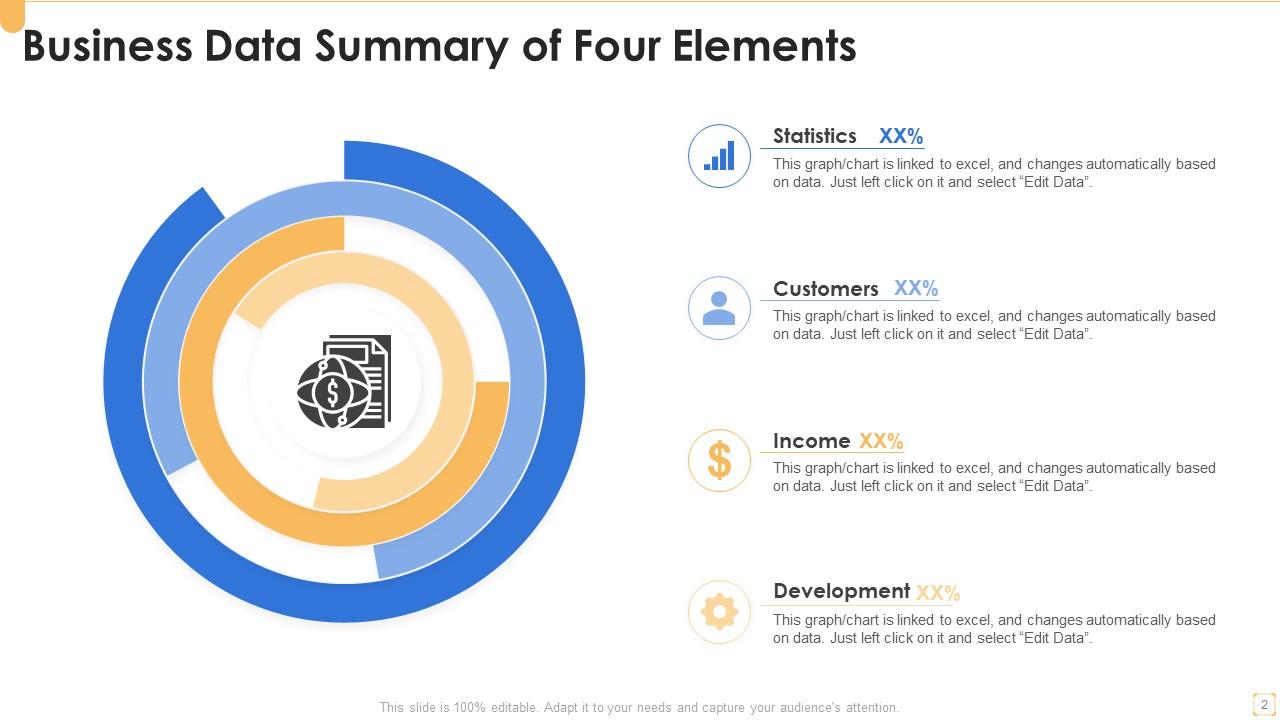
Template 5: Business Data Summary of Four Elements
Data management reveals the potential value of data reports and insights to provide real business effect. Use this PowerPoint Template to consider the four elements of business data to increase organizational capabilities. This presentation examines statistics, customers, income, and development to underline the importance of basic research in providing the business with the competitive edge. Use this download to provide an overview of key operational KPIs that must be delivered. Get it now!
Template 6: Data Summary for Competitive Analysis PPT
Need to create a competitive analysis report and see where you fit in the market? Use this PPT Template to create a company report to examine your market competitiveness. This slide can help you enhance your business plan by identifying your competitors and examining their strengths, weaknesses, products, and marketing tactics to identify prospects for your own company. Use this slide to convey an overview of competition and how your company compares to them. Get it today!
Template 7: Data Summary for Two Group Comparison PPT
Use this PPT Slide to build a group summary that displays the differences between data groups. This data analysis aids in determining the possibility of seeing specific patterns, correlations, or discrepancies in a dataset. Summarize and compare descriptive data about differences across one or more factors or groups of factors. Employ this presentation resource to create a data report based on sample data to draw inferences about the group. Grab it now!
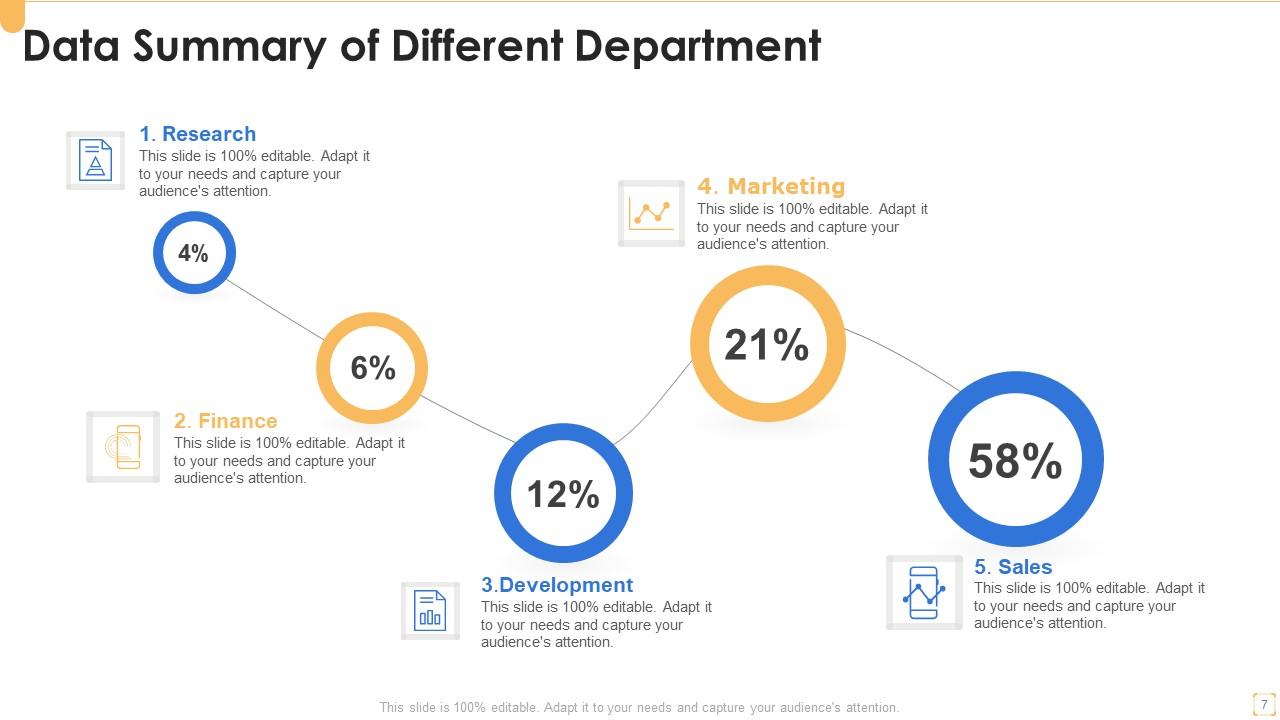
Template 8: Data Summary across Departments PPT Template
This PowerPoint Template facilitates the integration of comprehensive data across the organization’s departments. Use this slide to build a data report that helps in smoothing out the rough edges of organizational-wide activities. It shows R&D, Marketing, Sales, Development, and Finance departments. Learn more about your company’s operations and gain insights into how to improve them. Use this download to collect, organize, and analyze data to generate new ideas. Grab it now!
Template 9: Data Summary of Five Business Fields
Departments within a business handle and oversee distinct functions. Use this PPT Slide to create a company report to discuss the findings with stakeholders and make decisions based on the findings. This template aids in demonstrating a condensed version of critical business areas to enhance efficiency and decrease costs. Employ this download to examine the data that your firm generates and enhance your bottom line. Get it now!
Template 10: Data Summary of Statistics Trend
This PPT Template aids in the measurement of a company’s efficiency progress. This data management component is an ideal tool for capturing data over time and forecasting trends. It addresses operation efficiency and revenue growth to describe the overall change in a variable over time. This data summary provides in-depth insight of elements influencing business operations, allowing stakeholders and management to make more informed decisions. Make use of this slide to summarize and strategize your business plans. Get it right away!
The most logical, meaningful, and efficient approach to display descriptive statistics.
A data summary is a helpful tool for supporting organizational strategy and decision-making. Use SlideTeam’s PPT Templates to define baselines, benchmarks, and goals to keep moving ahead.
PS Explore SlideTeam’s Must-Have Financial Analysis Executive Summary Templates to highlight your financial strengths and issues with a thorough picture of the ratios and financial statement data required to analyze your company’s intrinsic worth.


 Customer Reviews


