


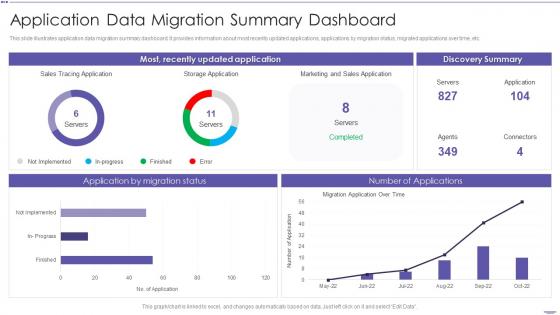
Application Data Migration Summary Dashboard Snapshot




Try Before you Buy Download Free Sample Product
 Impress Your
 Audience
 100%
100% Editable
 Save Hours
 of Time


This slide illustrates application data migration summary dashboard snapshot. It provides information about most recently updated applications, applications by migration status, migrated applications over time, etc.
People who downloaded this PowerPoint presentation also viewed the following :
Application Data Migration Summary Dashboard Snapshot with all 7 slides:
Use our Application Data Migration Summary Dashboard Snapshot to effectively help you save your valuable time. They are readymade to fit into any presentation structure.





FAQs for Application Data Migration
Track your migration percentage and data volumes first - those are the basics. Error rates matter too, obviously. Transfer speed is huge because waiting forever sucks when you're moving terabytes. I always check data validation results and make sure rollback's ready just in case. Don't forget system downtime and resource usage so you don't accidentally kill production (been there). Success/failure counts by table help you spot the messy areas fast. Set up alerts for error spikes and make sure you can actually dig into what broke when stuff inevitably goes wrong.
Dude, visualizations are a lifesaver for migration stuff. No more scrolling through endless logs trying to find what broke. Heat maps show you exactly which data sources are having a bad time, and progress bars keep everyone off your back about status updates. You'll catch problems way earlier instead of dealing with disasters later. Charts make bottlenecks super obvious too. Oh and set your dashboard to auto-refresh - trust me, you don't want to be that person mashing F5 every two minutes. Makes the whole process way less stressful honestly.
So migration dashboards are honestly lifesavers for catching the usual problems fast. You'll see data quality stuff right away - duplicates, missing fields, the works. Performance issues jump out when everything's moving like molasses. Mapping errors show up when your source data doesn't fit the target schema properly. Plus connectivity problems and those random timeout errors (why do those always happen overnight?). The whole thing gives you this overview of what's broken and where stuff gets stuck. Set up alerts for the big issues so you're not refreshing constantly.
Honestly, real-time monitoring is a game changer for migrations. When something breaks, you'll know right away instead of discovering it hours later when everything's already a mess. Migration speeds, error rates, data quality - you can watch it all happen live. If there's a bottleneck? Fix it immediately. Your stakeholders will actually leave you alone too since they can just check the dashboard themselves (thank god for that). The whole point is being able to pivot mid-migration rather than crossing your fingers and hoping for the best. Just set up some alerts for the critical stuff so you're not babysitting the screen 24/7.
Your dashboard's only gonna be useful if the data feeding into it isn't garbage. Bad source data = misleading metrics, and then you're making migration decisions based on total nonsense. It's like using a GPS that thinks you're still in 2019 - completely useless. Build validation checks into the dashboard right from the start. Don't wait until later when you're already knee-deep in problems. Clean data helps you spot bottlenecks early and actually track real progress. Honestly, I've seen too many teams skip this step and then wonder why their timeline went sideways.
Honestly, clean design is everything for migration dashboards. Your team needs to spot problems fast, not waste time deciphering some confusing interface. I've worked with dashboards that were absolute disasters - like someone just threw charts at a wall and called it done. Clear status lights, logical groupings, simple layouts - that's what saves you when things go sideways. During migrations you're already stressed enough without squinting at messy displays. Keep it simple so you can actually see what's broken at a glance.
Focus on trends instead of just snapshots - line charts work great for records migrated daily, error rates, processing speeds over the past month or so. Weekly rollups are way cleaner than daily data, trust me on that one. Daily gets messy fast. Annotate any weird spikes so your team can figure out what caused them - maybe a specific batch went sideways or something changed in the system. Oh, and keep major milestones visible somewhere. Set up alerts when performance goes off the rails compared to your usual baselines.
The Data Migration Dashboard is honestly a lifesaver for stakeholder updates. Point everyone there instead of drowning in "what's the status?" emails all day. During meetings, you can walk through the visual progress bars - even the non-tech people get it immediately. Different teams can track their own stuff without bugging you constantly. Plus you can set up automated reports so executives stay in the loop. I wish more companies actually used dashboards like this properly. Real-time visibility beats manual status reports every single time, and it'll save you hours of compiling updates.
Track different stuff depending on where you are. Planning phase? Data volume estimates, timeline accuracy, resource allocation. Extraction gets tricky - I'd watch data rates, error counts, and how your source systems are holding up. Processing speed and data quality scores matter during transformation. Loading is all about throughput and failed records. Honestly, the post-migration stuff is where people get lazy, but that's when you need integrity checks and user feedback most. Oh, and set alerts for anything that goes 10% off your baseline - trust me on that one.
Dude, set up automated alerts on your migration dashboard - it's like having a guard dog watching everything 24/7. You'll get pinged the second error rates jump or jobs crash, instead of checking manually every few hours (because honestly, ain't nobody got time for that). Way better to catch problems early than find out later that everything's completely broken. Focus on alerts for your most critical metrics. Your users won't even know there was an issue, and you won't be stress-eating at 2am wondering if something went wrong.
Tableau or Power BI are solid choices for this - they're built for real-time stuff. Grafana's another good option. If your devs want more control, Python with Dash or Streamlit is perfect (honestly, most developers prefer these anyway). You'll need something like PostgreSQL or InfluxDB on the backend to track progress, errors, and data quality. The specific tool isn't what matters most though. What you really need is visibility into what's actually happening during migrations. I'd start with whatever your team already knows - no point learning something totally new when you're already stressed about the migration itself.
Map out what each role actually needs first - that's key. Project managers want big-picture stuff like progress metrics and timelines. Technical teams need the nitty-gritty: error logs, data quality stats, all that detail work. DBAs are gonna want performance metrics and system health (plus they'll definitely whine if they can't see everything lol). Most migration tools let you build custom widgets and set permission levels. Create different dashboard layouts for each user type. Just show people the KPIs they actually care about - no point overwhelming someone with irrelevant data they'll never use.
Start with authentication and role-based permissions - seriously, you don't want random people seeing migration data. Encrypt everything in transit and at rest, though honestly that should be obvious by now. Audit logging is huge too so you can track who's poking around where. Oh, and definitely mask any PII in the dashboard views because that's just asking for trouble otherwise. My biggest advice? Loop in your InfoSec team right from the start. Trust me, retrofitting security later is a nightmare you'll want to avoid. Get that security checklist going early and you'll thank yourself later.
Honestly, just hook it up to whatever PM tool you're already using - Jira, Asana, whatever. Makes the dashboard way more useful since everything syncs automatically instead of you manually copying updates everywhere (which is the worst). Your team can see blockers and timelines without jumping between tabs constantly. Plus stakeholders can track migration stuff right next to their regular work. I'd set this up day one if I were you - saves so much time later. Oh, and the real-time updates actually work both ways, which is clutch.
Honestly, just make it stupidly easy for people to tell you when something's broken. Throw a quick rating thing right in the dashboard - people will actually use it if it's not annoying. Track what gets clicked vs what gets totally ignored, that tells you everything. I'd definitely do monthly check-ins with your main users too, they'll be brutally honest about what sucks. Oh, and set up alerts for when data goes sideways or things get slow. The whole point is catching issues before people start venting about it in random Slack channels.
-
Definitely recommend SlideTeam to all who need help with PowerPoint presentations. Their design team can create anything you need.
-
Exclusive and extensive collection of templates. Really helped me create a professional presentation in just no time.