Data is everywhere and everything in 2023, and this has been true of the internet economy per se now for over three decades. What started as a slow influx of data in business operations is today a gigantic necessity. Every organization relies on comprehensive analysis of data it has gleaned to gain real-time insights into its design of products and services, customer behavior, and act in line with such verifiable insights. An organization’s daily routines and operations comprise many moving parts, each essential to accomplishing a task or endeavor.
Data is information, and information is power. Click here to hone your data analysis abilities to put a research project in place.
Businesses use Data Flow Diagrams (DFD) to visualize how data moves through a process or system. Keeping track of every significant aspect of a project or complex business concept is critical. Organizations use these DFDs to improve their internal systems and processes with a clear outline of data flow, actors, and actions within a process or approach.
This fantastic tool and technique of DFDs makes it simple for everyone to present and communicate their viewpoints. There are two kinds of DFDs: Logical and physical. The former depicts theoretical processes of moving data through a system, whereas the latter represents the practical side of doing the same thing.
Explore our business process flow chart templates to streamline operations and save time and money.
This blog serves as a reference guide for system analysts, software engineers, IT professionals, and others to highlight the flow of information and sequential order of actions necessary to finish a task at work. Our team at SlideTeam has curated a list of the Top 7 Data Flow Diagram Templates to help you present a diagrammatic explanation of business system designs and managed data flow. These templates help identify potential faults or bottlenecks with their simplification of sophisticated processes and display of every step that goes into them.
The 100% customizable nature of the templates provides you with the flexibility to edit your presentations. The content-ready slides give you the much-needed structure.
Ensure that the critical parts of YOUR business have a clearly defined path with SlideTeam’s best-in-class PPT Templates!
Template 1: Data Flow Diagram PPT
Are you trying to convey a system’s process flow in complete detail, with crystal-ball clarity? Use this PPT Template to demonstrate an enterprise’s data processing workflow. This complete deck is an excellent tool for presenting information flow, data input sources, process orders, and the storage of data through DFDs in IT and engineering industries. This template includes critical components, development phases for a conventional DFD, and case studies. Use this presentation to help the team identify any potential inefficiencies and develop a top-notch system with a visual representation of each component. Get it now!
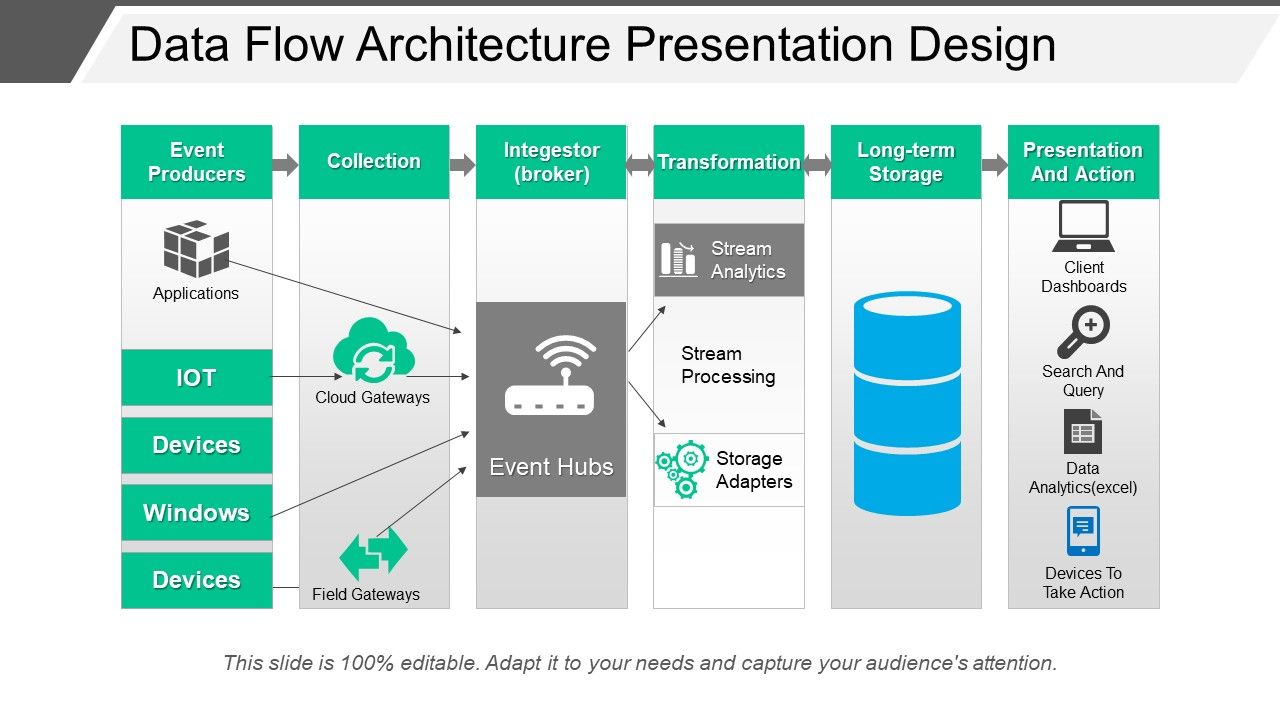
Template 2: Data Flow Architecture Presentation Design
Use this PPT Template to resolve any deadlock in your process framework. This template is a great data management tool to demonstrate the transformation of input data into output data via a sequence of computational or manipulative components. It offers a six-stage strategy encompassing big data, data architecture, and data management characteristics, emphasizing the data flow architecture of a company or an enterprise. This slide incorporates event producers, collection, investor, transformation, long-term storage, and presentation & action to create an efficient process framework. Download, enter your information, and present. Download now!
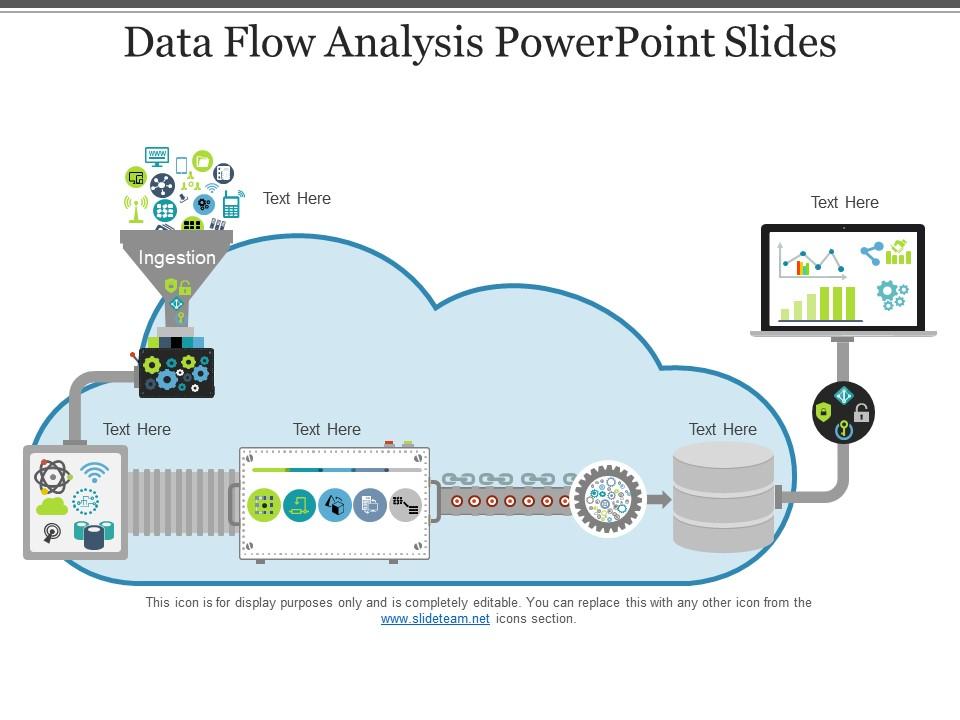
Template 3: Data Flow Analysis PPT
Do you want to optimize or troubleshoot your software? Use this PPT Template to effectively gather material needed to analyze data flow. This template is a fantastic resource for drawing inferences about programmatic paths while considering control flow and scaling to massive systems. Use the infographic to depict product development and project management states. This download will help you display possible data pathways through the software. Save it now!
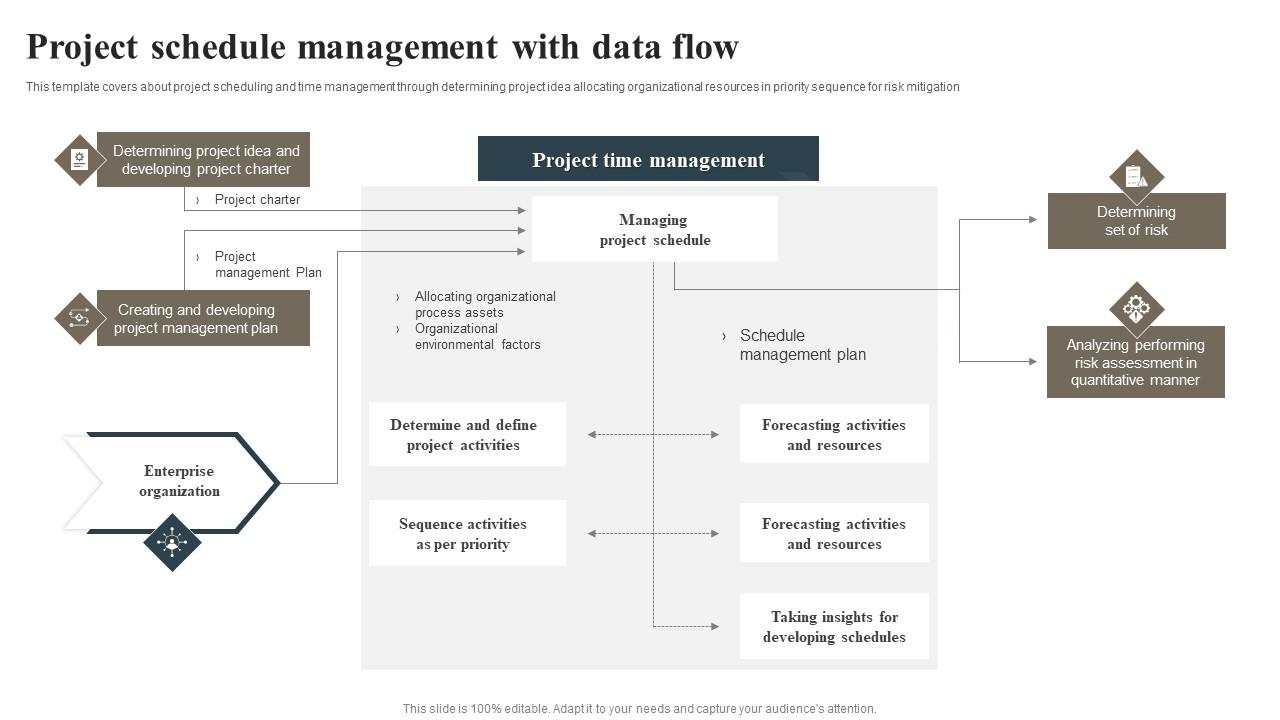
Template 4: Project Schedule Management with Data Flow
Need to develop a project schedule overview? Use this PPT Template to create a project management plan. This template depicts the application data flow and project process operations. It provides information on project scheduling and time management by prioritizing organizational resources according to project ideas for risk reduction. The slide includes enterprise organization, time management, and managing project schedules to demonstrate interconnected and parallel operations throughout the project life cycle. Download now!
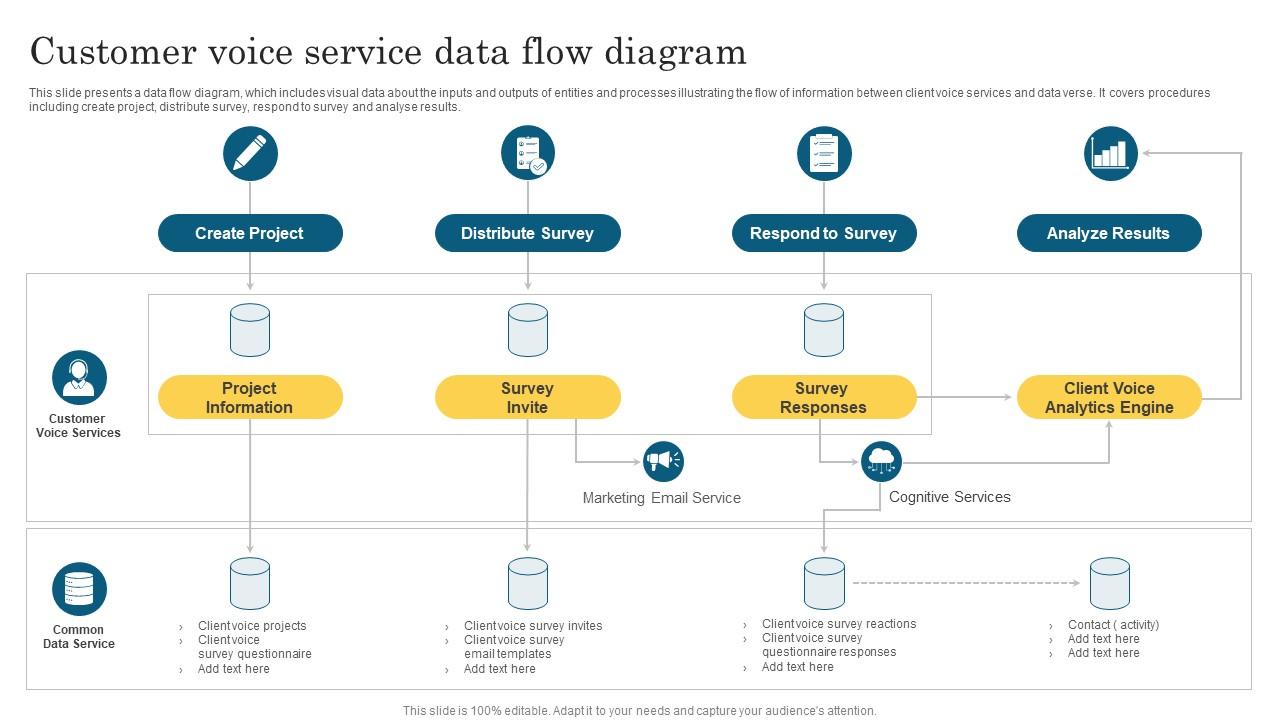
Template 5: Customer Voice Service Data Flow Diagram PPT
Use this PPT Template to illustrate the flow of information (data) among Customer Voice services. This presentation contains a data flow diagram showing entities’ and processes’ inputs and outputs, exhibiting information flow between client voice services and data verse. It involves creating a project, distributing a survey, responding to it, and analyzing the results to show how computers communicate with callers via voice recognition and Dual-Tone Multi-frequency Signaling (DTMF) keypad inputs. This download will assist you in visualizing the logical and physical structure of interactive voice response systems. Get it now!
Template 6: Data Flow Training Gap Analysis PPT
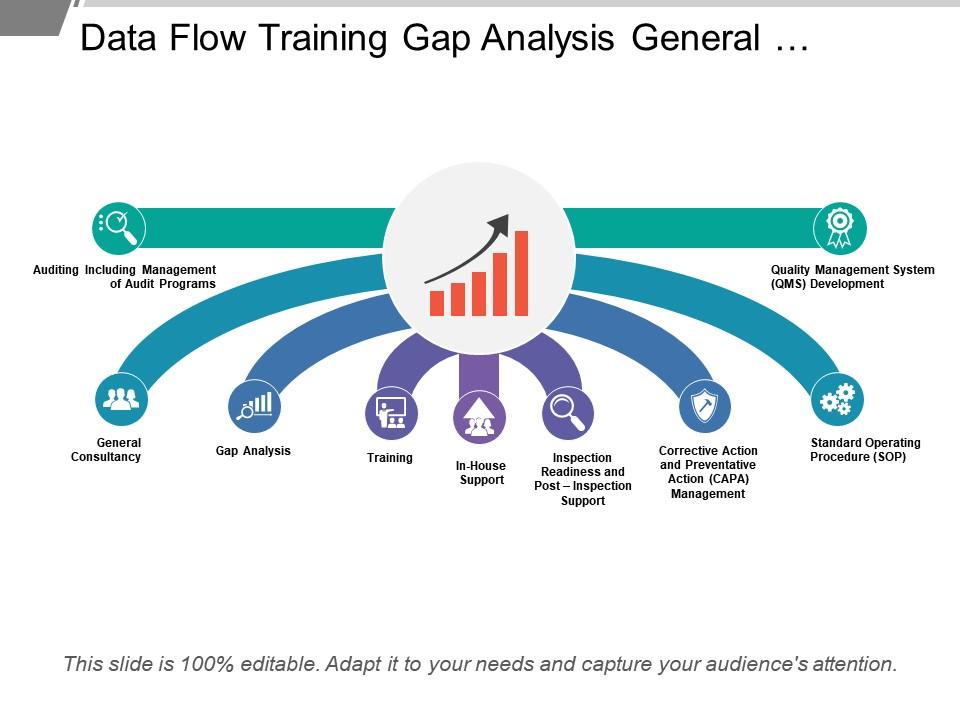
Are there any skill gaps that your team members struggle with? Use this PPT Template to evaluate a company service’s performance. This infographic offers a management plan that will provide a process framework for filling gaps with appropriate training and skill programs. It comprises a nine-stage process that includes audit programs, general consultancy, gap analysis, training, in-house support, inspection, Corrective Action and Preventative Action (CAPA) management, standard operating procedure (SOP), and quality management system development to create fully-equipped teams with diverse skill sets. Get it now!
Template 7: Sales Process Improvement Data Flow PPT
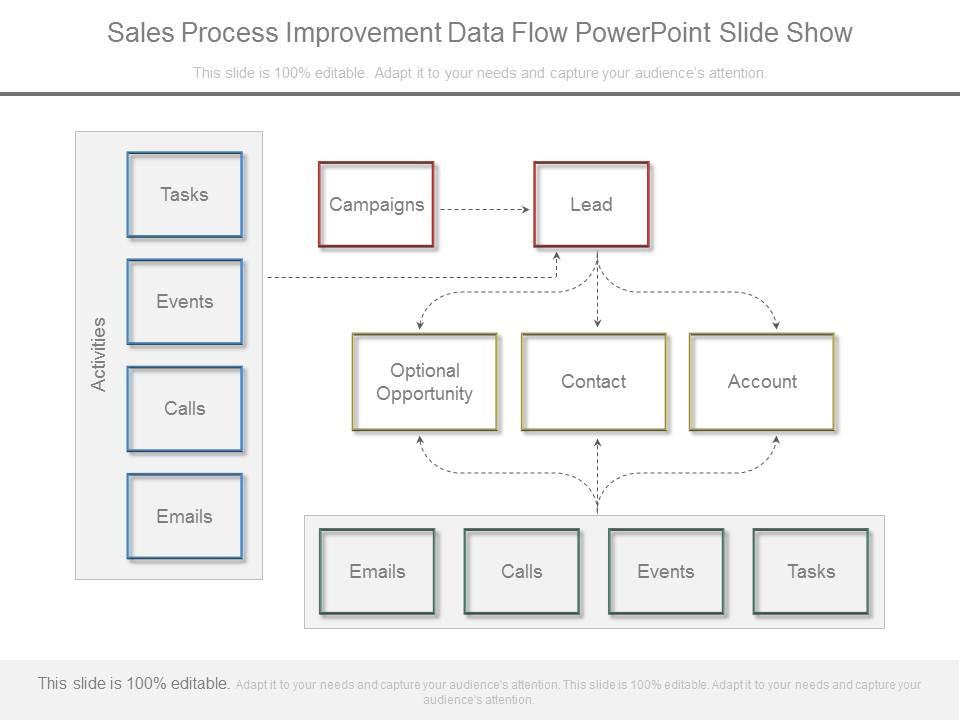
Use this PPT Template to develop clear process improvements for forecasting sales volumes. This layout depicts a structure for developing an efficient management plan for enhancing your techniques to boost the sales strategy and make knowledgeable improvements. It incorporates key performance indicators (KPIs) such as tasks, events, calls, emails, activities, campaigns, leads, optional opportunities, contact, and account to optimize the sales process. Create a well-oiled, revenue-generating sales process using this presentation. Get it now!
******
SEEING, RATHER THAN JUST LOOKING
Data flow diagrams provide substantial insights into the process and bring up new possibilities for defining and improving performance. Use SlideTeam’s PPT Templates to inform project stakeholders about procedural flow inside your company or a specific project.
PS Check out our guide on data warehouse templates to receive a centralized and unified view of your organization’s data.
FAQs ON DATA FLOW DIAGRAM
What is a data flow diagram?
Data flow diagrams (DFDs) depict data flow in a business system graphically. It describes methods to transfer data using predefined symbols of rectangles, circles, arrows, and short-text labels. Data flowcharts can be as basic as hand-drawn process overviews or as detailed as multi-level diagrams. Logical and physical DFDs are two types of data flow diagrams. Analytical data flow diagram demonstrates how data moves through a system to perform certain business operations. The physical data flow diagram illustrates how logical data flow works.
How to make a data flow diagram?
Step 1: Decide what you want your diagram to achieve or the results of your system or process.
Step 2: Arrange the components of your system or process into a DFD-based classification.
Step 3: Draw a context diagram to show the high-level scheme’s outline. This will show the detailed route data takes from input to output.
Step 4: Construct a level 1, 2, or 3 DFD using your context diagram. Create and connect elements to your sub-processes to elaborate on the diagram.
Step 5: Proofread your DFD to ensure its accuracy. Examine each level and phase, paying attention to the flow of information.
What are the four components of a data flow diagram?
Entities: Data source and destination are examples of entities.
Process: Tasks done on data are referred to as processes. A circle represents the process.
Data Storage: The database of the system is included in data storage. A rectangle represents it with two smaller sides missing or two parallel lines.
Data Flow: Data flow refers to data movement within a system. An arrow signifies it with the source at the arrow’s tail, while the destination is at the head.





 Customer Reviews

