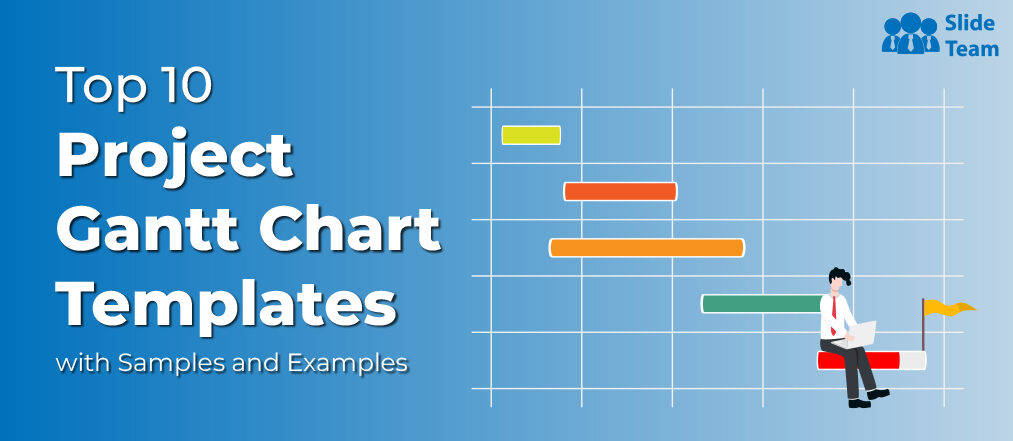
Henry Laurence Gantt, An American mechanical engineer and management consultant, was renowned for his scientific management developments. His legacy for the management world is the bar graph-style project schedule and management tool, technically known as the Gantt Chart or Project Gantt Chart.
Let’s understand more about this project data and schedule management tool in this blog!
What is a Project Gantt Chart
It is a bar graph or chart used to develop and manage project schedules, activities, or tasks with their dependencies and duration. The two axes of the Gantt chart enlist the tasks (horizontal) and their time intervals (vertical). The width of flat-lying (mostly color-coded) bars represents the duration. The start and finish dates/times of the terminal and summary elements are mentioned on the two ends of the activity, representing the streak. It leads us to the secondary purpose of Gantt Charts — exhibiting the project Work Breakdown Structure (WBS).
Modern Gantt charts demonstrate the dependency (Precedence Network or PDM) of project activities. Using a vertical line (as “TODAY”) in Gantt charts, administrators will be able to show the current project schedule status or percentage complete with multi-color shading.
Project Gantt Chart Templates: The Ultimate Schedule Management Tool
Even before the Gantt Chart, some primitive versions (like Harmonogram by Karol Adamiecki) were there. What makes Henry’s version popular is its visualization elements and wide-scale use (in industries, projects, and management practices). Our Project Gantt chart presentation templates have similar attributes. With their eye-catching graphics and themes, these customizable PowerPoint-based project Gantt chart templates will ease your schedule development, task management, performance comparison, WBS, progress tracking, and dependency relation.
Find the best Project Gantt chart template(s) that suit your business requirements from the list below!
Bonus: Project Management Process Presentation Deck
Understand and develop the basic and advanced elements of project management (PM) with the help of this complete presentation deck. It includes the Gantt chart template, project management plan development & implementation process with principles, and agile project management framework. This deck includes the process for clinical trials, management groups, and knowledge area mapping to support the project management process. Download it now!
1. Project Gantt PowerPoint Presentation Template
This presentation deck is a compilation of the project Gantt chart templates to help you schedule and manage multiple (industries) assignments. It contains project Gantt chart sample templates for organization sales strategy presentation, digital marketing tasks, new website development schedule, IT application development schedule, new product development, and marketing promotion tasks. You will find a Gantt chart template for comparing, linking, and managing multiple projects in one place. Grab it today!
2. Project Management Gantt Chart PPT Presentation Template
This PPT Layout is the basic format of a professional and elegant Project Gant chart. It has tasks and activities written horizontally and months (time) on the vertical axis. With the help of color-coded strips of this elegant project Gantt chart PowerPoint Slide, you can categorize the project tasks into management, operational, sales, and other categories and highlight dependencies between these. Download it now!
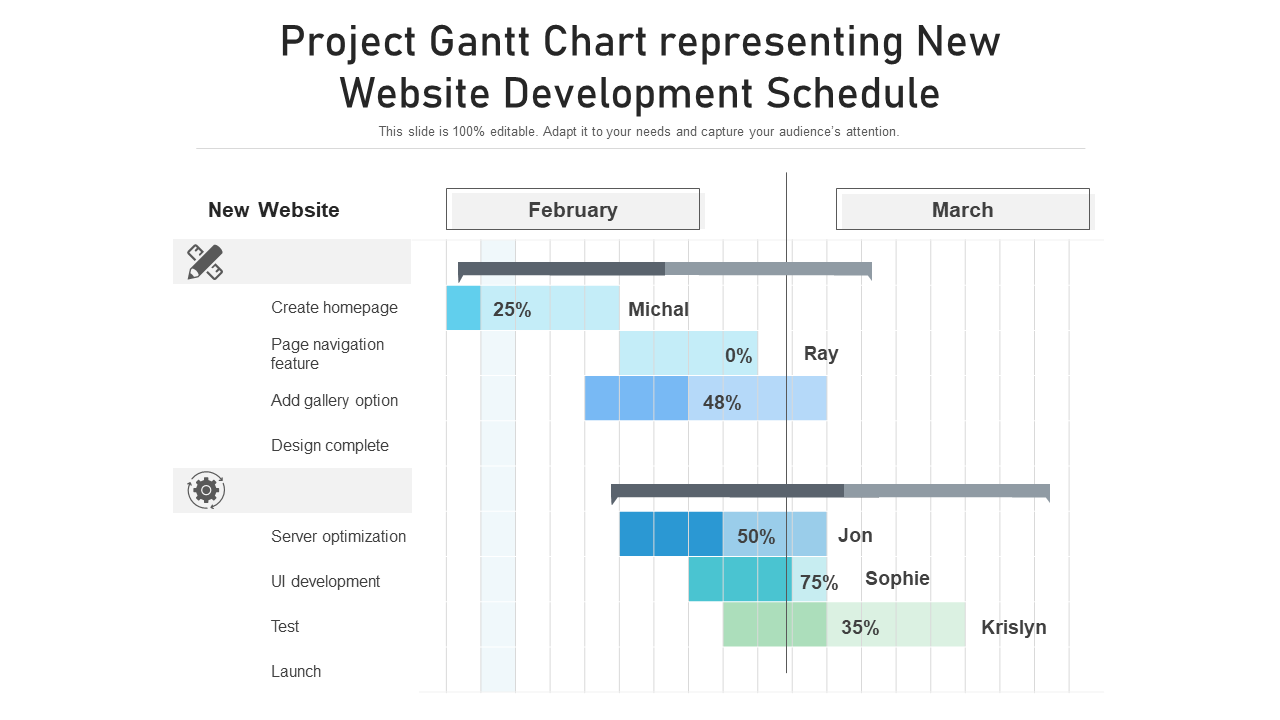
3. Project Gantt Chart Template for New Website Development Schedule
Developing and running a website is no small feat. It includes small, complicated, but critical tasks like designing, SEO, coding, building, and more. Use this Gantt chart template to supervise and navigate website design projects efficiently. Get it now!
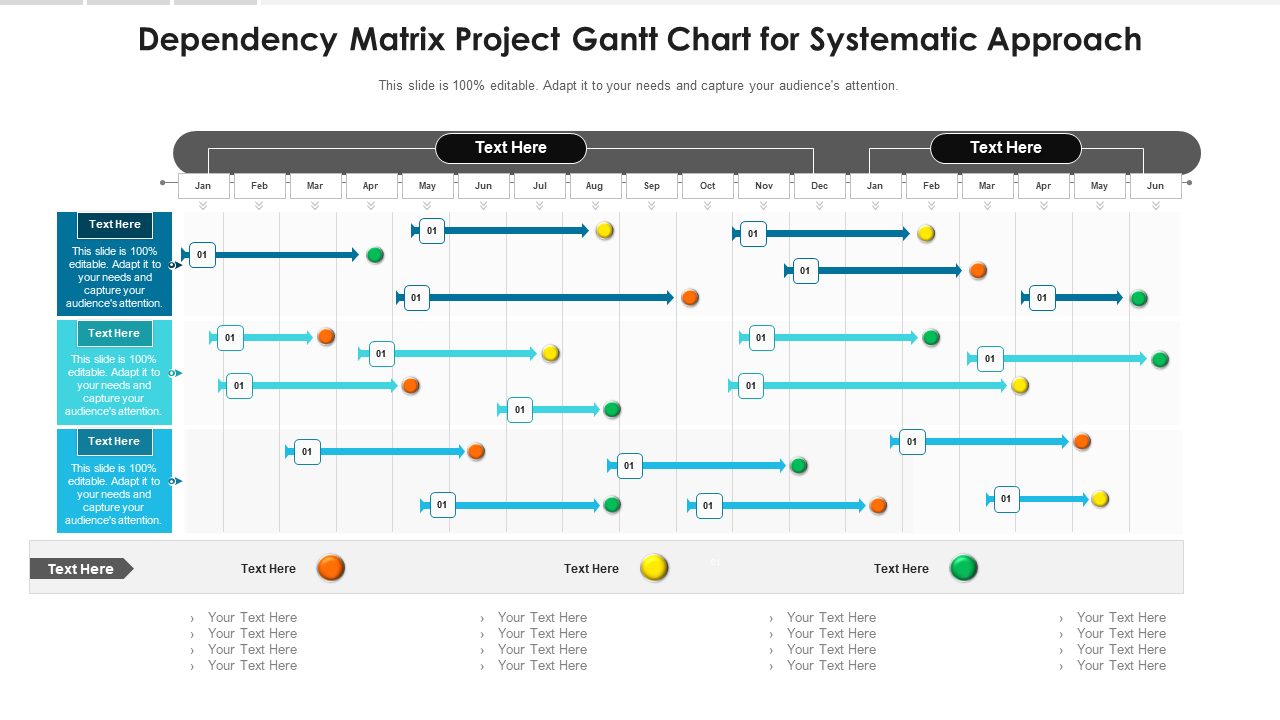
4. Dependency Matrix Project Gantt Chart Template for Systematic Approach
Not using the right tools for the systematic management of business projects will cost you a lot of time and dime. This PPT Layout will save you from the headache of using multiple tools for project management. With this single PowerPoint Gantt chart graphic, you will make task or progress tracking, precedence management, and prioritization a breeze. The three buttons (green, yellow, and orange) can signify the task’s priority or progress. The number at the bars can help you set the order of task completion or show activities that need to be done repeatedly in a complete project. Use text boxes to add insights or instructions. Get it now!
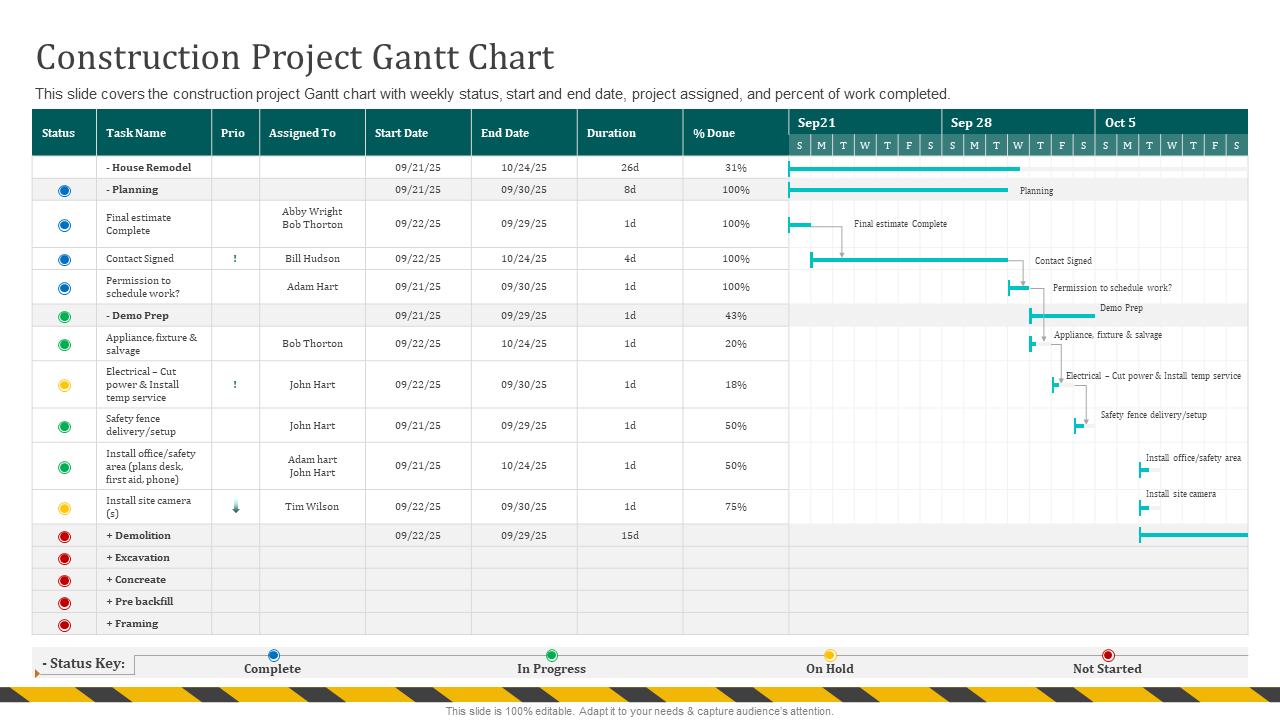
5. Construction Project Gantt Chart Presentation Template
A contractor knows the intricacies of data related to vendors, phases, and documents/software involved in a construction project. This project Gant chart template will help you manage and complete the (small or big) construction projects in a professional yet cake-walk way. It has ready-to-fill columns for mentioning tasks (name), assigning priority, responsible person, recording start-end date, duration (in standard unit), and percentage of tasks completed. With color-coded buttons, you will make it easy to note the task status in seconds. Get it now!
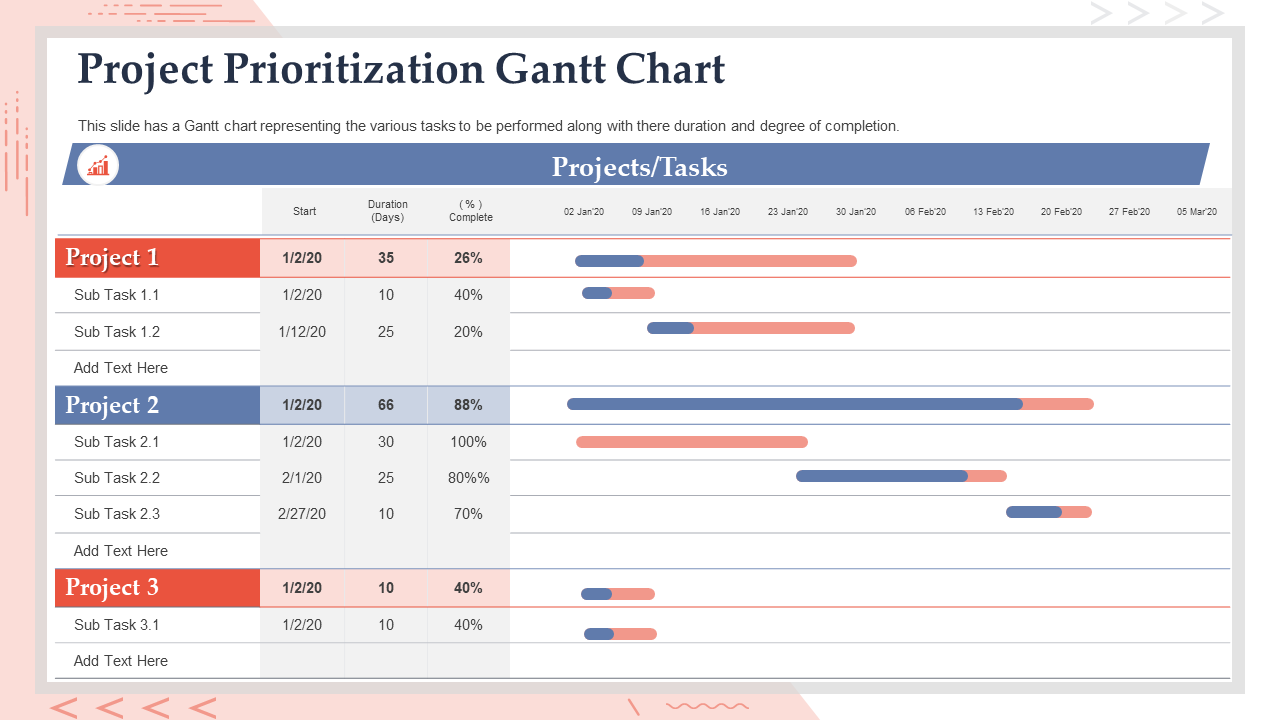
6. Project Prioritization Gantt Chart Presentation Template
Analyzing the business impacts of projects under their wings is also a responsibility of a project manager. For this, they need to examine these projects on parameters like duration, completion percentage, resources consumed, etc. Take advantage of this PowerPoint design to manage and present multiple projects in one go using a Gantt chart. It allows you to exhibit details of more than three projects with their sub-tasks, duration for each task completion, and progress percentage. Download it now!
7. Legal Project Management Gantt Chart Presentation Template
Using project management techniques (planning, scheduling, budgeting, risk management) to manage legal work and improve the efficiency and effectiveness of legal services is Legal Project Management (LPM). This project Gantt chart Template will provide legal firms with a tool that helps organize, record, track, and analyze multiple ongoing or potential legal works. It will be a valuable tool in planning for cases that frequently recur, using historical data, and preparing in advance for a new type of case. Grab it today!
8. Quality Management Plan Gantt Chart Analysis PPT Template
A comprehensive quality management plan and schedule are necessary to complete the project to client satisfaction. This Gantt chart template will help you manage project elements like work quality, each team member’s contribution, and weekly progress. It will also help you monitor, control, and present the development of project phases like analysis, design, development, and testing. Get it now and meet the client’s work expectations!
9. Project Management Gantt Chart Presentation Template
Planning the project activities/phases to perfection from their initiation date to duration and expenditure is necessary to keep it aligned (with deadlines and resources) and profitable. This Gantt chart template will help you not only plan but also record the actual outcomes or deviations in your planning. Managers will find it useful in gathering data and insights that lay the foundation of advanced project planning. It also has a column to demonstrate the completion percentage and a graphical presentation for dates and durations. Click the link below to acquire it!
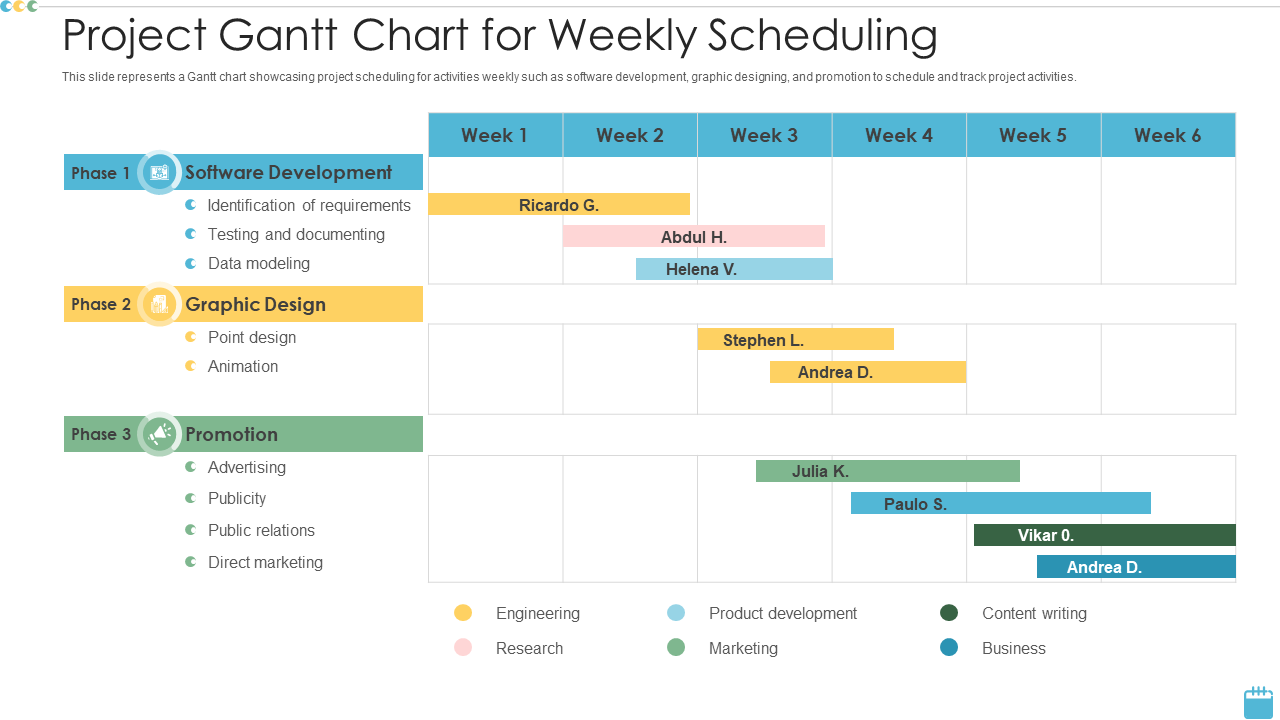
10. Project Gantt Chart Template for Weekly Scheduling
Most projects need contributions from organizational teams like research, engineering, development, marketing, etc. It is easier for team supervisors to track their teams’ progress than the complete project supervisor(s). This Gantt chart template will help you develop and manage a schedule highlighting the progress and responsibility of each team in project development. You can assign a color to each team and mention it in the Legend. Use the team color bars to present the week-wise (duration) contribution of each group to the project phase. Add the name of the person responsible for transparency, facilitating communication, and motivating employees. Share this project’s Gantt chart templates with all participating teams and get the desired results!
To Cut a Long Story Short!
Gantt charts are a powerful tool in project management. These provide a clear illustration of the project schedule, help identify the critical path, facilitate communication, identify potential delays, assist in resource allocation and facilitate change management. They are an important tool for managers to monitor and manage their projects in an effective manner.
With our plug-and-play Project Gantt chart templates, devise these world-renowned and widely adapted management instruments by just putting your data. These PPT Layouts are your ideal option for creating pocket-friendly and reusable (without recurring fee) Project Gantt charts.
Download high-quality Project Gantt Charts Templates from the links shared above, or explore more PPT Designs with a visit to this page.
FAQs on Project Gantt Charts
1. How do you make a Gantt Chart for a project?
Creating a Gantt chart for your project is a great way to visualize tasks with the timeline within which these need to be completed. Here’s a step-by-step guide to help you make your own Gantt chart:
1. Start by listing out tasks that need to be completed for your project. Be sure to include any sub-tasks or smaller components of each task.
2. Assign a start and end date for each task, considering any dependencies or constraints. For example, a task that requires input from another team member may need to start after that team member has completed their own task.
3. Use a spreadsheet or project management software to create a table with columns for the task name, start date, end date, and duration.
4. Using the start and end dates, create a timeline along the top of the chart. This will serve as the “x-axis” for your Gantt chart.
5. Use horizontal bars to represent each task, with the length of the bar representing the duration of the task. Place these bars on the chart according to the start and end dates assigned in step 2.
6. To make your Gantt chart more informative, you can add milestones, deadlines, and critical paths.
7. Finally, use colors or symbols. For example, you could use a green color for completed tasks, a yellow color for in-progress tasks, and a red color for tasks that are behind schedule.
2. What is the main purpose of a Gantt chart?
A Gantt chart is like a map for your project’s journey. It’s a tool that helps you navigate the complex and often winding path of completing a project on time and within budget. Gantt chart aims to provide a visual representation of your project’s tasks, timelines, and dependencies. Think of it as a birds-eye view of your project. It lays out all the tasks that need to be done and shows how they’re all connected. It’s like choreography, where each task is a move, and the chart is the script. This chart shows the start-end dates of each task. It’s also like a traffic control system for your project.
A Gantt chart allows you to see which tasks are on schedule and running late, so you can be proactive. It’s like a traffic light, green for on schedule, yellow for behind schedule, and red for critical tasks. With a Gantt chart, you can ensure that your project is moving in the right direction.
3. What are the three main benefits of using a Gantt chart?
- Visual representation of tasks and timelines: A Gantt chart provides a clear visual representation of tasks required to be completed for a successful project and their respective start and end dates. It makes it easy to understand the project schedule and quickly identify potential delays or issues.
- Improved project planning and coordination: Gantt charts help project managers plan and coordinate the project more effectively by clearly laying out all tasks and dependencies. They can easily identify tasks that can be done in parallel and those dependent on completing other tasks.
- Enhanced communication and collaboration: Gantt charts are also useful for communicating project progress and schedules with team members, stakeholders, and clients. It can help to keep everyone informed of where the project stands and to identify potential issues early on, enabling the team to take corrective action.




 Customer Reviews






![How to Build an Effective Project Management Playbook? [Template Included] [Free PDF Attached]](https://www.slideteam.net/wp/wp-content/uploads/2022/06/30-1013x441.png)
