

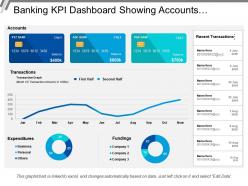
Banking kpi dashboard showing accounts expenditures fundings





Try Before you Buy Download Free Sample Product
 Impress Your
Audience
 100%
Editable
 Save Hours
of Time


Convince folks that you are ideally equipped for the assignment with our Banking Kpi Dashboard Showing Accounts Expenditures Fundings. Impress them with your credentials.
People who downloaded this PowerPoint presentation also viewed the following :
Banking kpi dashboard showing accounts expenditures fundings with all 6 slides:
Get everybody immediately aware of the facts with our Banking Kpi Dashboard Showing Accounts Expenditures Fundings. It acts as an effective circular.


FAQs for Banking kpi dashboard showing
So ROA and ROE are your bread and butter - they show how well the bank's actually making money from its assets and equity. Net interest margin's another big one. Cost-to-income ratio is pretty crucial too since it tells you if they're burning cash on operations. Oh, and don't sleep on the credit stuff - non-performing loans and loss provisions can really bite you if things go south. Capital adequacy keeps the regulators off your back. Honestly there's like a million other metrics, but these'll give you a decent read on whether your bank's got its act together or not.
So customer satisfaction is like the domino that knocks everything else over in a good way. Happy customers stick around longer, buy more products, and cost way less to keep. They also tell their friends about you instead of complaining online - which honestly saves you a ton in marketing spend. I've noticed that when CSAT or NPS scores start dropping, your revenue usually follows a few months later. It's weird how predictable it is. Track those satisfaction numbers religiously because they'll give you a heads up before your other metrics tank. Way better than finding out when it's too late.
So this ratio shows how much of customer deposits a bank loans out. You'll want it around 80-90% - that's the goldilocks zone. Below that? Bank's being lazy with their money, basically leaving profits on the table. Above 90% gets sketchy because they might not have enough cash if everyone suddenly wants withdrawals. I always compare it to similar banks rather than looking at just one number - trends matter way more than a single snapshot. Also helps to know what's normal for that type of bank since community banks often run different ratios than big national ones.
So for tracking how efficient your bank's operations are, there's a few metrics that actually matter. Cost-to-income ratio is the big one - anything under 60% is solid. Also look at cost per transaction and revenue per employee. Processing times for loans and account stuff obviously. Digital adoption is kinda everything right now since online transactions cost like pennies compared to someone walking into a branch. Track your error rates too, plus how many payments go through without manual intervention (straight-through processing, they call it). Honestly, just pick 3 or 4 of these based on where you're bleeding money and see how you stack up against competitors.
You'll want to focus on credit risk stuff first - NPL ratio, provision coverage, loan loss provisions. Capital adequacy ratio is huge since regulators are obsessed with it. For liquidity, track your coverage ratio and net stable funding ratio. Operational risk is honestly more of a pain to measure, but watch fraud losses, compliance issues, and when systems go down. Oh, and concentration risk by sector/geography - can't ignore your biggest exposures. I'd build around what regulators want first, then add your own metrics later.
So basically banks are totally flipping their success metrics because of digital transformation. Mobile app engagement and online transaction volumes matter way more than branch visits now - which honestly makes sense since who even goes to branches anymore? They're obsessing over digital account opening rates and customer acquisition costs through apps instead of traditional stuff. Plus all their efficiency tracking shifted to automated processes and AI resolution times. My advice? Start watching digital engagement numbers alongside your old-school metrics. That's where you'll actually see what customers are doing these days.
So basically divide your total acquisition costs by new customers you got that month. But here's the thing - break it down by channel because some are ridiculously expensive (TV ads, ugh). Most banks do a 12-month rolling average to deal with seasonal weird stuff. Don't forget ALL the costs though: marketing, sales salaries, tech, even those little branch snacks. I'd start with whatever channel you're spending the most on first. Track it monthly and compare to lifetime value - that's how you figure out which channels aren't burning your money.
Here's what I'd do - pick like 3-5 key metrics and watch them religiously. Things like how long customers wait, whether you solve their problem on the first call, satisfaction scores. Real-time dashboards are a game changer because who wants to fix last month's mess? When wait times start climbing or people get annoyed, boom - you know exactly where to throw more people or do some quick training. Honestly, these numbers tell you way more than angry customer emails ever will. Check them weekly, maybe even daily if things are crazy.
So NIM is basically your profit margin on loans - it's the spread between what you pay depositors vs. what you charge borrowers, shown as a percentage of earning assets. Higher is better since you're making more on each loan dollar. But don't get too greedy - price yourself way above competitors and you'll lose the good customers to someone else. I'd check it monthly honestly, maybe compare against industry benchmarks so you can catch any weird trends before they bite you. It's really just about knowing how efficiently you're making money from your core business.
Yeah, regulatory compliance metrics are basically non-negotiable for banks - they're like the foundation everything else sits on. Capital adequacy ratios, liquidity coverage, stress tests - regulators don't just suggest these, they demand them. Miss your targets? You're dealing with fines or regulatory smackdowns (trust me, executives hate that drama). These numbers usually carry serious weight in performance reviews and can trump other KPIs when things get tight. Honestly, the whole system feels pretty rigid sometimes. But here's what matters for you: figure out which compliance metrics actually touch your role and how they flow down to your team's goals.
Don't look at KPIs by themselves - that's the worst trap. Like, your loan growth might look amazing, but what if credit quality is tanking? You're basically missing the whole picture. Month-to-month numbers get super noisy too, so focus on actual trends instead of freaking out over random blips. Oh, and always compare yourself to similar banks. I've seen people celebrate "improvements" that are actually terrible compared to their peers. The real question is what story all these metrics tell when you put them together, not just individual wins here and there.
Honestly, analytics is a game-changer for KPI tracking. Instead of waiting a month to see what happened, you'll get real-time data you can actually do something with. Set up dashboards that pull from your loan systems, deposits, customer stuff - whatever matters most. The cool part? Predictive analytics shows you loan defaults or churn before they hit, not after. I'd definitely start with your biggest pain points first though. Don't go crazy trying to track everything right away - that's how you end up overwhelmed and ignoring the whole system.
So you wanna know what actually matters for bank marketing? Start with customer acquisition cost and conversion rates - those'll tell you real quick if you're wasting money. Lifetime value is huge too since banks make most profit long-term. Trust metrics like Net Promoter Score are critical (obviously, it's people's money). Digital engagement rates matter tons for younger customers. Oh, and cross-selling success - that's where the real money is once you've got someone in the door. Honestly though, just focus on acquisition cost first. Everything else can wait until you know which campaigns aren't just burning cash.
So investment management KPIs are all about portfolio performance and growing client wealth. You're tracking assets under management, how funds perform against benchmarks, client retention - that stuff. Retail banking's totally different though. They care about customer acquisition, deposit growth, loan volumes, cross-selling ratios (like turning checking accounts into credit cards). The timing's weird too - investment folks look at quarterly or annual performance while retail banks obsess over monthly, sometimes daily numbers. I swear retail banking managers live in spreadsheets. Just make sure you're not mixing up the metrics when you're setting targets for each side.
Honestly, employee performance metrics are like your crystal ball for what's coming next. Happy, productive staff = happy customers who actually stick around and spend money. It's pretty straightforward when you think about it. I'd focus on things like productivity ratios and employee satisfaction scores first - way more useful than just staring at financial reports all day. Those people metrics will give you a heads up before your revenue starts going sideways. Plus, there's only so much you can do after the financial damage is already done, you know?
-
Awesome presentation, really professional and easy to edit.
-
Appreciate the research and its presentable format.