

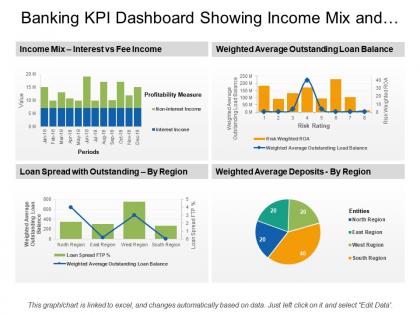
Banking kpi dashboard showing income mix and loan spread




Try Before you Buy Download Free Sample Product
 Impress Your
 Audience
 100%
100% Editable
 Save Hours
 of Time


Dovetail your thoughts with our Banking Kpi Dashboard Showing Income Mix And Loan Spread. They guarantee an accurate fit.
People who downloaded this PowerPoint presentation also viewed the following :
Banking kpi dashboard showing income mix and loan spread with all 6 slides:
Impress folks with your impeccable choice due to our Banking Kpi Dashboard Showing Income Mix And Loan Spread. Blindly go by your intuition.

FAQs for Banking kpi dashboard showing income mix
Essential banking KPIs include loan portfolio performance, net interest margin, cost-to-income ratio, customer acquisition costs, and regulatory capital ratios. These metrics enable financial institutions to monitor profitability, operational efficiency, and risk management simultaneously, with many banks finding that comprehensive dashboards streamline decision-making and enhance competitive positioning.
Data visualization improves banking KPI interpretation by transforming complex financial metrics into clear charts, graphs, and interactive dashboards that highlight trends, anomalies, and performance patterns at a glance. Through intuitive visual formats, banking professionals can quickly identify risk indicators, track loan performance, and monitor regulatory compliance metrics, ultimately enabling faster decision-making and more strategic resource allocation across operations.
Real-time data transforms banking KPI dashboards by enabling immediate detection of performance anomalies, instant risk assessment, and rapid response to market fluctuations or customer behavior changes. This immediacy allows banks to make proactive decisions on loan approvals, fraud detection, and resource allocation, while providing executives with current insights for strategic planning, ultimately delivering competitive advantage through faster, data-driven decision-making.
Banks can tailor KPI dashboards by customizing metrics, visualizations, and data filters to align with each department's specific objectives and operational focus. Risk management teams prioritize metrics like credit default rates and compliance indicators, while retail banking focuses on customer acquisition costs and loan approval times, ultimately enabling targeted decision-making and enhanced departmental efficiency.
Banks face challenges including data integration from multiple legacy systems, ensuring real-time accuracy across departments, selecting relevant KPIs that align with regulatory requirements, and creating intuitive interfaces for diverse user roles. These complexities often result in fragmented reporting, delayed insights, and compliance gaps, with many financial institutions finding that streamlined dashboard design ultimately delivers enhanced operational efficiency and better regulatory transparency.
Historical data analysis integrates into banking KPI dashboards through predictive analytics engines, machine learning algorithms, data visualization tools, and automated trend identification systems. These technologies enable banks to forecast loan default rates, predict customer churn, and anticipate market fluctuations, while streamlining risk assessment processes, ultimately delivering proactive decision-making capabilities and enhanced competitive positioning.
Customer satisfaction metrics significantly influence banking performance KPIs by driving customer retention rates, cross-selling opportunities, net promoter scores, and lifetime customer value calculations. Banks with higher satisfaction scores typically experience reduced churn rates, increased deposit growth, and enhanced profitability per customer, with many financial institutions finding that satisfied customers generate 2-3 times more revenue through additional services.
**INPUT**: What are the best practices for choosing the right software to develop a banking KPI dashboard? **OUTPUT**: Best practices include evaluating real-time data processing capabilities, regulatory compliance features, integration flexibility, scalability options, and robust security protocols. Banks increasingly find that software combining seamless core banking integration, automated reporting functions, and customizable visualization tools delivers enhanced operational efficiency and regulatory transparency, ultimately enabling faster decision-making across risk management and customer service operations.
Compliance and regulatory metrics can be effectively showcased through real-time monitoring displays, risk heat maps, audit trail summaries, regulatory ratio tracking, and exception alerts. These dashboard components enable banks to streamline oversight by providing instant visibility into capital adequacy ratios, anti-money laundering indicators, and stress test results, ultimately delivering enhanced regulatory transparency and faster compliance reporting.
Mobile-friendly banking KPI dashboards enable real-time access to critical metrics, enhanced decision-making flexibility, improved operational responsiveness, streamlined executive reporting, and seamless cross-device functionality. These solutions empower bank executives and managers to monitor loan performance, customer acquisition rates, and risk indicators from anywhere, ultimately delivering faster strategic responses and competitive advantage in an increasingly dynamic financial landscape.
Banks ensure KPI dashboard accuracy through robust data governance frameworks, automated validation systems, real-time monitoring protocols, and regular audit procedures. These systems streamline data quality by implementing source verification checks, establishing clear data lineage tracking, and maintaining standardized reporting processes, with many financial institutions finding that automated reconciliation tools significantly reduce errors while enhancing regulatory compliance and strategic decision-making capabilities.
External economic factors significantly impact banking KPIs through interest rate fluctuations affecting net interest margins, economic downturns increasing loan default rates, and market volatility influencing trading revenues and asset valuations. These macroeconomic shifts directly alter profitability ratios, credit quality metrics, and operational efficiency measures, with many financial institutions finding that robust dashboard monitoring enables proactive risk management and strategic adjustments during economic uncertainty.
Predictive analytics enhances banking KPI dashboards by forecasting future trends, identifying potential risks, and enabling proactive decision-making rather than reactive responses. Through machine learning algorithms, banks can anticipate loan defaults, predict customer churn, and optimize resource allocation, while streamlining operational efficiency and delivering competitive advantages in an increasingly data-driven financial landscape.
Banks can encourage staff engagement through gamification elements, personalized goal setting, regular training sessions, and connecting KPIs directly to performance incentives. By implementing real-time alerts, creating department-specific views, and establishing recognition programs for achievement milestones, financial institutions foster a data-driven culture where employees actively monitor metrics, ultimately delivering improved operational efficiency and enhanced customer service outcomes.
Banks measure KPI dashboard effectiveness through user engagement metrics, decision-making speed improvements, and correlation between dashboard insights and business outcomes like loan approval times or customer satisfaction scores. Through regular stakeholder feedback sessions, A/B testing different visualization approaches, and tracking whether key metrics actually drive strategic actions, financial institutions can iteratively refine their dashboards, ultimately ensuring these tools enhance operational efficiency and competitive advantage.
-
Design layout is very impressive.
-
Designs have enough space to add content.