


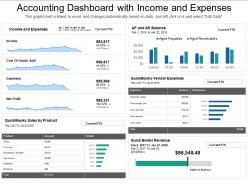
Accounting dashboard with income and expenses


Try Before you Buy Download Free Sample Product
 Impress Your
 Audience
Editable
of Time


Thinking to create an innovative presentation design for your next business presentation. If yes, then check our accounting dashboard with income and expenses PPT template. This wonderful accounting dashboard with income and expenses PowerPoint slide show comes with editable charts and graphs which reflect percentages consumed over a period. To show the business data, you need to ensure that you are showing it in the best possible way. Giving importance to every number which you show in the slide is crucial as your team needs to understand the significance of numbers. This accounting dashboard with income and expenses Presentation visual is designed by keeping in mind the need for every organization. Moreover, this accounting dashboard PPT slide has time-saving capabilities and is extremely spacious to include vast content under single screen view. Just download the presentation graphic and then share it with who so ever you are looking to share with. Folks consider your advice a gift due to our Accounting Dashboard With Income And Expenses. It helps distribute goodies.
People who downloaded this PowerPoint presentation also viewed the following :
Accounting dashboard with income and expenses with all 6 slides:
Feed your craving with our Accounting Dashboard With Income And Expenses. Satisfy all your inner desires.
FAQs for Accounting dashboard with
Honestly, cash flow should be your top priority - it's literally what keeps you alive. Track your current cash, how old your receivables are, and your burn rate so you know when you'll go broke. Monthly recurring revenue and profit margins matter too, obviously. Oh and all the tedious stuff like outstanding invoices and where your money's actually going (seriously, Starbucks will bankrupt you). Debt-to-equity ratio and working capital round out the basics. You can get fancy with other metrics later, but nail these first.
Okay so automation basically cuts out all that tedious data entry stuff you're always doing. Your ERP and bank feeds just sync automatically instead of you copying numbers around all day. Reports generate themselves too - honestly feels weird at first but you get used to it. You'll spot mistakes way faster since everything updates live. The dashboard stays fresh without you doing anything, which is pretty sweet. Oh and start with whatever takes you the longest manually. That's where you'll actually notice the difference right away.
For financial dashboards, line charts work great for tracking trends over time. Bar charts are your best friend when comparing different periods or categories. KPI cards? Perfect for highlighting key stuff like revenue and margins. Honestly, people go crazy with pie charts but they're awful for financial data - just don't. Color coding helps a ton (red for losses, green for gains). Keep things clean with white space so it doesn't look cluttered. Put your most critical numbers at the top and group related stuff together. Nobody wants to hunt around for context when they're trying to make decisions quickly.
Honestly, real-time data is such a lifesaver compared to those awful month-end reports we used to wait for. You'll catch cash flow issues before they blow up, see which clients are dragging their feet on payments, spot weird spending patterns early. Leadership asks about budget stuff? You've got current numbers, not some outdated spreadsheet from last Tuesday. Quick vendor decisions don't turn into guessing games anymore. Oh, and definitely set up those automated alerts for important metrics - saved my butt more times than I can count. Your financial picture stays fresh instead of feeling like ancient history.
Honestly, good UX can make or break accounting dashboards. Your team's already stressed enough during month-end without fighting a terrible interface, right? Poor design leads to mistakes and wasted time hunting for data. You want intuitive navigation that actually matches how people work - not some designer's fantasy workflow. Clear visuals matter too. Most dashboards I've seen are cluttered messes. Start by watching your users struggle through their daily tasks. You'll spot the pain points fast. Trust me, shadowing them for even an hour will give you more insights than any meeting ever could.
For your multi-currency dashboard, show both original amounts and converted values next to each other. Real-time exchange rates are key - just make sure you timestamp them so people know how current the data is. Color coding or currency symbols help distinguish everything at a glance. Put a base currency selector at the top where users can easily switch views. Oh, and definitely include a conversion rate table somewhere visible. Trust me, your team will want to double-check the math occasionally, especially during month-end when everyone's being extra careful about the numbers.
Honestly, the data integration stuff will make you want to pull your hair out - accounting info is always spread across like 5 different systems. Getting people to actually use it is another battle entirely. Nobody wants to learn new tools, even good ones. Figure out which metrics actually matter instead of throwing everything at the wall. Budget's always tight, security team will freak out about new software, and dirty data will mess everything up. Oh, and don't forget to find those few people who love new tech - they'll help sell it to everyone else. Map your data sources first though, that's step one.
Dude, get an accounting dashboard set up. You'll see your cash flow happening in real time instead of waiting weeks for reports. Super helpful for catching payment delays before they screw you over. I wish I'd done this sooner honestly - you can spot seasonal trends and set alerts when cash gets low. The aging receivables tracking alone is worth it. No more getting blindsided by cash crunches because you'll actually see money moving in and out as it happens. Way better than flying blind with your finances.
Start with multi-factor authentication if you haven't already - it's like the front door lock for your financial stuff. Role-based access is clutch too, so people only see what they actually need for their job. Encrypt everything, both stored data and when it's moving around between systems. Regular security audits will catch stuff before it becomes a nightmare. Also set up session timeouts because people love leaving things logged in forever (drives me crazy honestly). Don't skip the backup and recovery procedures either. MFA gives you the biggest security boost for the least hassle, so that's where I'd start.
Honestly, just focus on what actually moves the needle for your specific business. Retail? You want inventory turnover and same-store sales right up top. SaaS company? MRR and churn rate are your bread and butter. Most tools let you drag stuff around pretty easily anyway. Here's what I'd do - ask your team what numbers they're constantly digging for in spreadsheets right now. Those are probably your core 5-7 metrics. Everything else just clutters things up. I learned this the hard way when I first built a dashboard with like 15 different charts. Nobody looked at half of them.
Honestly, cloud dashboards are pretty sweet for accounting stuff. You can check your numbers from literally anywhere - coffee shop, couch, whatever. No more waiting for IT to update things or worrying about backups crashing. Your whole team sees the same data at once, which cuts down on those "wait, which version are we looking at?" moments. Way cheaper than buying licenses for everyone too. The scaling thing is clutch - you're not stuck paying for features you don't need. I'd mess around with a few different ones first though, since they all feel different once you're actually using them daily.
Daily updates are your best bet, honestly. Weekly works too if daily feels like too much. Real-time is just overkill - accounting numbers don't bounce around like stock prices or anything. I'd set it up so you get fresh data every morning, makes it way easier to catch problems before they get weird. Monthly? Nah, that's too slow. You'll miss stuff that could've been fixed weeks ago. Most systems can automate daily updates anyway, so why not? Then just see how often people actually look at it and dial it back if needed.
Honestly, mobile accounting dashboards are a lifesaver when you're always on the go. You can check cash flow or approve expenses right from your phone - super helpful when you're stuck at the airport or between meetings. Real-time updates mean you'll catch problems early instead of finding out about them later. I personally love that you don't have to be chained to your desk to make big financial calls. Set up push notifications for urgent stuff too. Trust me, it beats scrambling to find a computer every time something needs your attention.
Honestly, adding historical data to your dashboard is a total game changer. You'll start seeing seasonal patterns and can actually track how your KPIs perform over months or years. Way better than just looking at current numbers in isolation. Plus it makes spotting weird financial stuff so much easier - like is that dip normal or something to worry about? Forecasting becomes actually useful instead of just guessing. And when you're presenting to people who hate spreadsheets (so... everyone), visual trends tell the story for you. I'd say start with 12-month trend lines on your main metrics.
So these collaboration tools are pretty clutch - your whole team can work on the same financial stuff without chaos. Everyone sees real-time updates instead of those annoying email threads where you're like "wait, who's doing what again?" You can drop comments on transactions, assign tasks, and track reviews. Month-end close becomes way less stressful. Plus approval workflows let senior people review before anything gets locked in. Oh, and definitely set up those role permissions first so Karen from HR can't accidentally mess with your reconciliations. Game changer honestly.
No Reviews