“Remind people that profit is the difference between revenue and expense. This makes you look smart,” American author and cartoonist Scott Adams has said.
Being a marketer, are your efforts driving sales? Is your sales team acing their targets? If yes, then where and how it shall reflect? To track and analyze revenue generated by your brands, you need a revenue dashboard. But why do you need to dig into your revenue figures? It is because most business rely on traditional metrics to know whether their business is performing or not.
For instance, profit is revenue minus expense. But what if the revenue is not from sales, but from the sale of an important business asset like machinery. Should it be considered that year? If so, why?
More pertinently for the purpose of this blog, why should it be used to calculate the profit? Needless to say, the profit figure will be inflated, and MISLEADING.
Hence, there arises the need for a revenue dashboard, where you compare apples with apples and not pineapples with apples.
Do you want to provide “at-a-glance” information about your business performance? Go through the collection of our premium-quality dashboards and scorecards PPT templates and attain the set goals of your company without any fuss.
Are you still wondering that what exactly is the use of a revenue dashboard? Or how to develop a revenue dashboard for your business? If so, then continue reading this blog and let all your doubts melt away!
A REVENUE DASHBOARD!
For every business, it’s essential to keep an eye on revenue to understand the trend on a quarter-on-quarter or year-on-year basis to make better decisions. A revenue dashboard is a must-have as it allows you to track increase or decrease in the revenue generated by your company in real-time, monitor progress against set revenue objectives, and assess the efficacy of your revenue strategy (for instance, plans to generate new sales, increase your recurring revenue and prevent customer churn etc).
Moreover, it will integrate with other platforms such as payment processor APIs (Paypal, Stripe, Braintree, Recurly, Chargebee, QuickBooks, etc.) to accurately portray revenue and all related metrics in one unified view.
Looking for a tool to display your marketing data and key performance indicators (KPIs) to identify your daily, monthly, weekly, or annual performance? If so, then this guide will help you design a perfect marketing dashboard and will assist you in making data-driven decisions for better results.
SlideTeam is offering a tailor-made collection of Top 10 Revenue Dashboard Templates. Grab these pre-built templates to track some of the most common revenue metrics, KPIs, etc., and analyze your revenue performance with just a few clicks.
Let's explore now!
Template 1: Business Performance Dashboards with Average Revenue and Customer Lifetime Value Template
If you are looking to evolve your business, increase brand awareness, and boost your bottom line, then embrace this business performance dashboard template. Use it to showcase how much income you generate, highlight your good investments and enhance data management processes, through average revenue and customer lifetime.
Template 2: Business KPI Dashboard Showing Revenue and Customer Lifetime Value Slide
Do you want to know how your company is doing? Assimilate this KPI dashboard template to track and analyze performance towards goals and business objectives. This design is divided into a four-stage process to highlight information about the dashboard, KPI, and business performance in terms of average revenue per customer and its comparison with previous year.
Template 3: Monthly Revenue Performance Measure Dashboard PPT Design
To have extensive financial knowledge of your company, monitor your top-down budgets, profits, and loss on a monthly bases with this top-notch PPT Slide. This template is designed with a befitting visual to discuss total revenue, revenue per source, deals, etc., and interpret your finances. Deploy this PPT Design to divvy up your financial details using infographics.
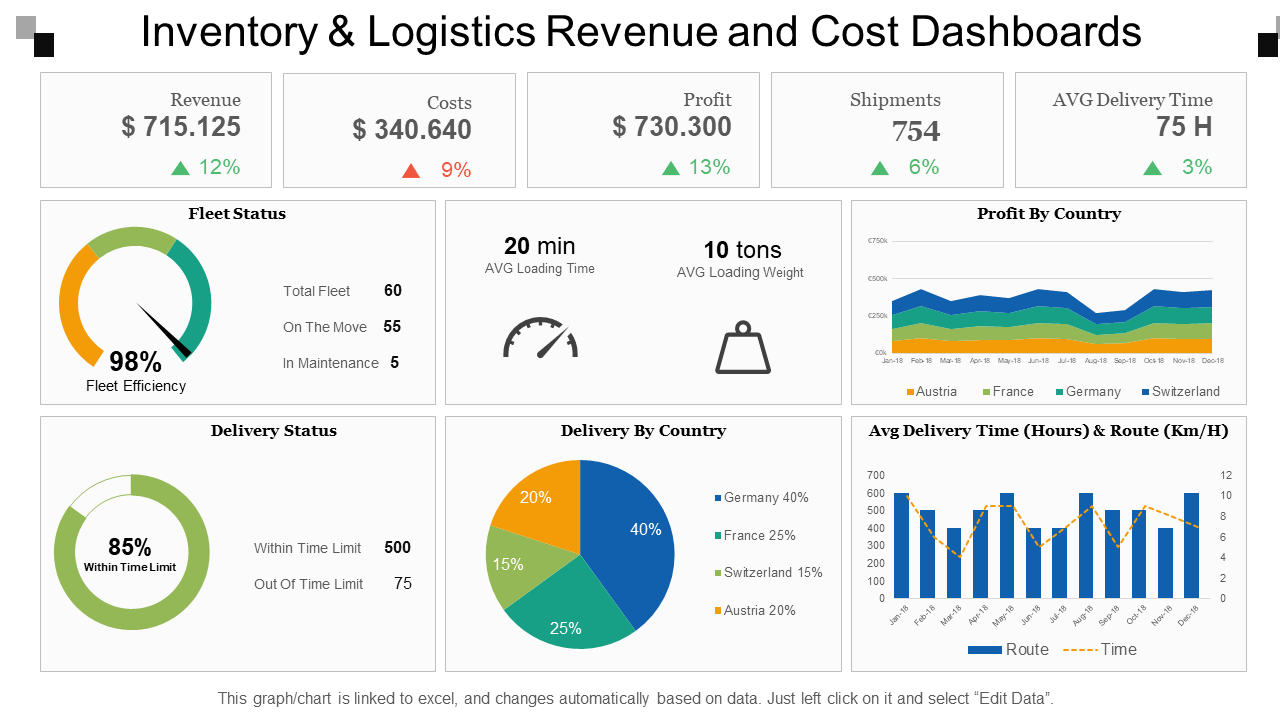
Template 4: Inventory and Logistics Revenue and Cost Dashboards Design
Use this dashboard design to manage your supply chain, logistics, and warehouse operations through KPIs, metrics, and data. With this template, you can help your vendors cut costs in the distribution process, and facilitate both shippers & carriers to manage their supply chain. Showcase fleet status, delivery status, revenue, costs, profit, and much more.
Template 5: Financial Ratio KPI Dashboard Showing Revenue Net Profit Margin and Debt to Equity
To communicate financial reports, deploy this financial ratio KPI dashboard template. It provides data-driven donut charts, line graphs, and pre-design visuals to present financial KPIs, accounting ratios, financial statements, etc. Examine cash management, tracking expenses, sales, profits, and performance of financial factors as well. Mesmerize your audiences with a download of this template!
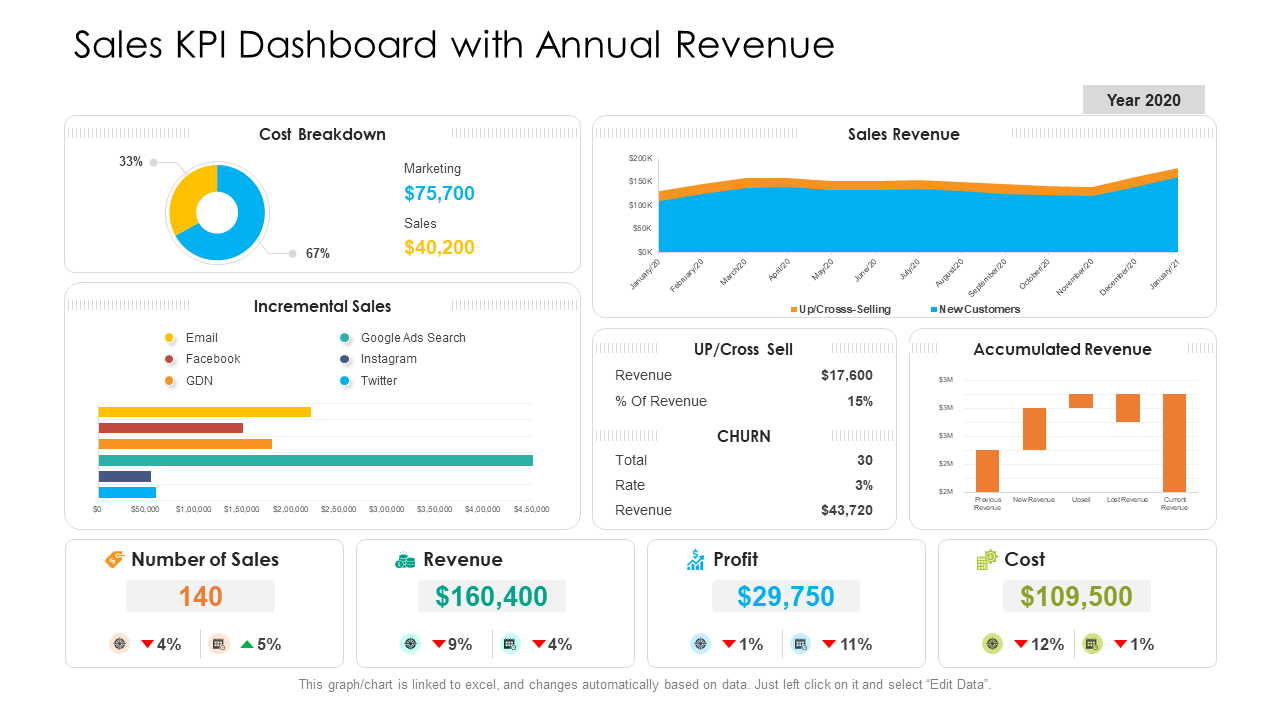
Template 6: Sales KPI Dashboard with Annual Revenue Template
Looking for an actionable outline of your sales metrics so you can analyze your sales team's performance? If so, then this template will be the best fit for your needs. This PPT Design will help you in presenting data related to profit, loss, revenue, cost breakdown, number of sales, sales revenue, etc. through graphs in a single template.
Template 7: Business Analytics Dashboard Snapshot with Revenue Per Product Line and Detailed Profit Template
To avoid any fuss, deploy this business analytics dashboard template with custom data-driven charts. Divided into an eight stage process, this PPT template offers bar graphs, lines, pie charts, etc. to showcase revenue per product line, detailed profit of total product, market share, etc.
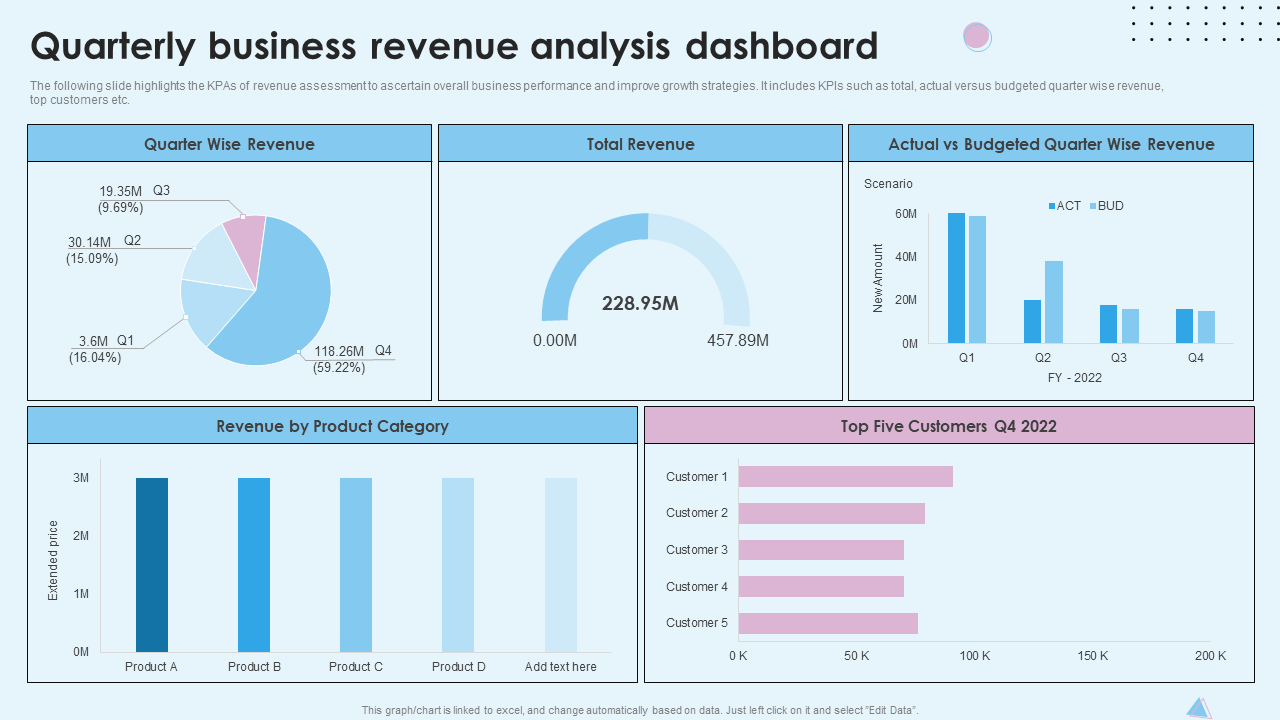
Template 8: Quarterly Business Revenue Analysis Dashboard Template
To ascertain overall business performance and improve growth strategies, deploy this business revenue analysis dashboard template. Highlight the KPAs of revenue assessment without a fuss. This blue and pink color PPT template with bar graphs and pie charts allows you to discuss total revenue, actual versus budgeted quarter wise revenue, top customers and revenue by product category.
Template 9: Sales Performance and Product Revenue Dashboard Template
Highlight the relationship between sales performance and product revenue with the assistance of this tailor-made revenue dashboard template. Use this PPT Slide to display data related to sales performance, top products in revenue and sales by contact method, and to engage customers with your products and services via regular interaction. Display aspects of sales such as profit, revenue, profit margin, etc.. Grab this eye-catching slide now!
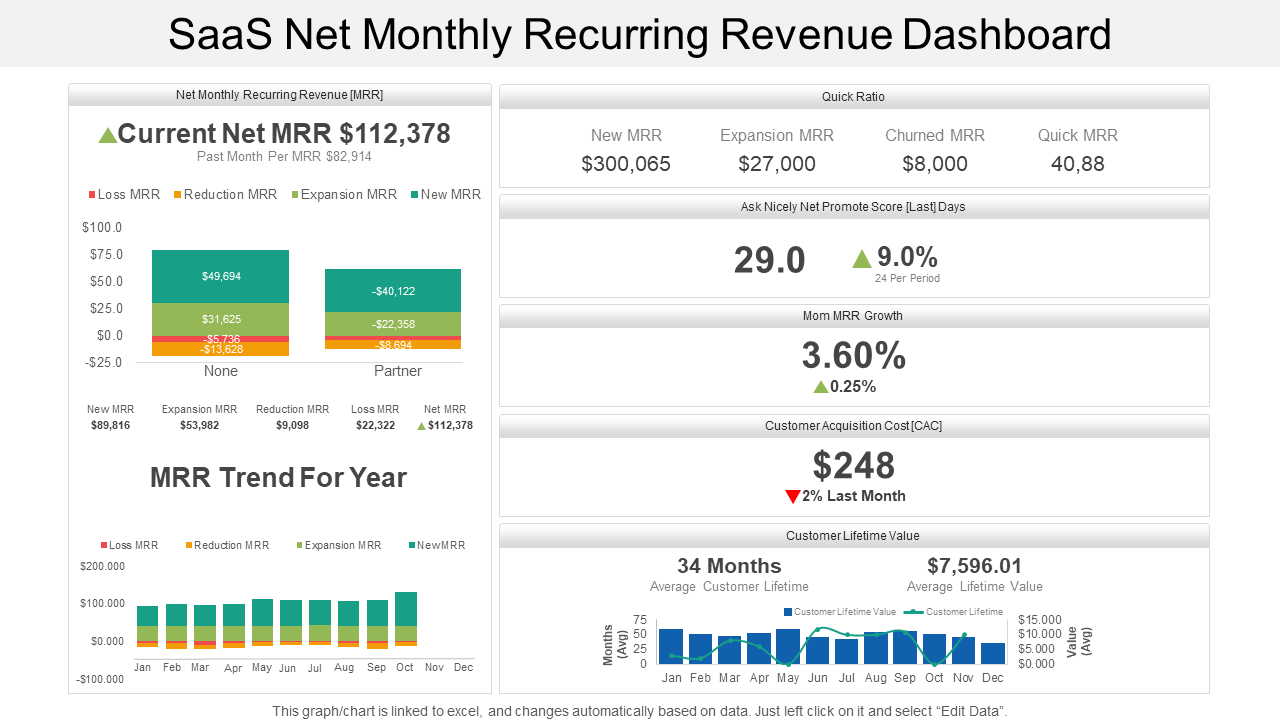
Template 10: SaaS Net Monthly Recurring Revenue Dashboard Template
In any business, creating a report on monthly recurring revenue (MRR) is a primary parameter. This metric is used by SaaS companies to measure the expected and recurring revenue elements of their business. If you feel it is a tricky task, deploy this PPT Template and calculate the MRR with ease. It will also help you identify factors that foster efficiency. Present your monthly recurring revenue with ease with this PPT Template!
The Bottom Line!
A revenue dashboard is a great tool to add to your sales and marketing arsenal because it delivers an overview of the revenue activity for the sources of your business over a specific time period.
What are you waiting for? Track revenue metrics and KPIs with the assistance of these Top 10 Revenue Dashboard Templates and analyze your revenue performance with just a few clicks.
Want to nail your next presentation, but facing an issue in creating your revenue dashboard? Get in touch with our Design Services Team and customize a ready-to-present dashboard specific to your needs in no time!
PS: If you have to present reports in your presentation, have a look at this collection of industry dashboard templates.
FAQs on Revenue Dashboards
What are dashboards in business?
A dashboard is a business intelligence (BI) reporting tool that provides a visual representation of your business performance related data. The primary intention of a dashboard in business is to provide information at-a-glance, and the most important KPIs (Key Performance Indicators) are measured or visualized for effortless understanding. It increases data accessibility and transparency across the business and is helpful to both regular business users and advanced data analysts in monitoring high-level insights into performance.
What is a Revenue Dashboard?
A revenue dashboard is a tool for benchmarking tax policy performance which provides the revenue related metrics to policymakers and researchers in one unified view. It also provides information like the sales rep’s contribution to revenue, lead source revenue attribution, revenue flow over time, and revenue by product to conduct a high-level analysis. It even displays the estimated revenue for your order purchases.
What should be included in a revenue dashboard?
Revenue dashboards, also known as financial dashboards, are often used by executives and CFOs to track trends and variances in the company income. Your revenue goals should determine a few common revenue metrics that you will want to see on your revenue dashboard. Although the exact revenue metrics will depend on your business model, but here are a few universal revenue metrics you should look for:
- Total customers.
- New customers.
- Total revenue.
- Average revenue per customer.
- Expansion revenue.
- Average customer lifetime value.
- Trial-to-paid rate.
- MRR (monthly recurring revenue).
- Active subscriptions.
- Churn rate (gross & net).
- Reactivation revenue.
What are the benefits of revenue dashboards?
A revenue dashboard helps you track the growth or decline in real-time in for the revenue generated by your company, monitor progress and assess the significance of your revenue strategy. It also helps managers and stakeholders to:
- Identify possibilities to boost revenue.
- Track campaign performance and bring changes in real-time.
- Figure out high-performing squad members.
- Disclose potential stumbling blocks.
- Forecast revenue figures.
- Identify most profitable customers.


 Customer Reviews


