


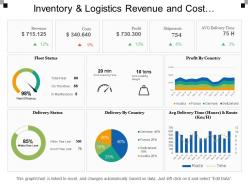
Inventory and logistics revenue and cost dashboards





Try Before you Buy Download Free Sample Product
 Impress Your
 Audience
 100%
100% Editable
 Save Hours
 of Time


Display erudition of a high class. with our Inventory And Logistics Revenue And Cost Dashboards. Get acclaimed for your intelligence.
People who downloaded this PowerPoint presentation also viewed the following :
Inventory and logistics revenue and cost dashboards with all 6 slides:
Handle the hiccups with our Inventory And Logistics Revenue And Cost Dashboards. Get over the initial hassles.
FAQs for Inventory and logistics revenue
Track your stock turnover rates and days of inventory first - those are your bread and butter. Lead times matter way more than people think, especially when suppliers get flaky. I'd also watch reorder points per SKU, stockout frequency, and carrying costs. ABC analysis helps you focus on the stuff that actually moves money. Dead stock percentage is huge too - nothing worse than inventory just sitting there collecting dust. Oh, and set up real-time alerts when you hit minimums. Trust me, dashboards are useless if they're not actionable.
Honestly, real-time integration is a total game-changer - no more working with yesterday's stale numbers. Your inventory, shipments, warehouse capacity all update instantly as stuff happens. We used to waste so much time on manual updates (ugh, don't miss that). Now you catch problems like stock-outs or delays immediately instead of days later when it's too late. I'd start with your WMS and transportation systems first - those give you the biggest bang for your buck accuracy-wise. Makes such a difference when you can actually trust what you're looking at.
So predictive analytics basically lets you see what's coming before it hits. Your system looks at past sales, seasonal stuff, and crunches all that data to warn you when products might run low. Game changer, honestly. You'll catch potential stockouts early instead of scrambling when you're already out. Way better cash flow too since you're not panic-ordering or sitting on too much inventory. I'd start with alerts for your best sellers first - those hurt the most when you miss them. Saves so much headache down the road.
Honestly, dashboards are a game-changer for this stuff. Pull in your key metrics - delivery rates, quality scores, lead times - straight from your procurement system. Way better than drowning in Excel hell all day. I'd focus on your top 5-10 critical suppliers first, then expand from there. Track delivery variance, defect rates, cost changes over time. The visual charts make problem suppliers obvious instantly. Most platforms let you set alerts when things go south, which is clutch. Start simple though - don't try to track everything at once or you'll overwhelm yourself.
Bar charts work best for comparing turnover across categories or time periods. Heat maps are clutch when you've got tons of SKUs - you can instantly see what's moving vs what's just sitting there. Honestly, I always throw in some trend arrows next to the important numbers too. Color coding helps a lot - green for good turnover, red for the slow stuff. Oh and definitely add benchmark lines so people know what they're shooting for. Sparklines are pretty neat if you want something compact. Your team will spot problems way faster with visual cues like that.
So user roles are basically who gets to see what data and do what actions on your dashboard. Warehouse managers need the real-time inventory stuff and fulfillment numbers. Executives just want the big picture KPIs and trends - they don't care about the weeds. Front-line workers only need their specific tasks and alerts, nothing fancy. Procurement teams are different though - they need supplier performance and reorder notifications. Honestly, mapping this out upfront is such a drag but trust me on this. Design your permissions first, then build the interface around those levels. You'll thank yourself later when everyone starts asking for changes.
Oh man, these dashboard templates are honestly a game changer. Instead of being stuck with someone else's setup, you get to customize everything for how your team actually works. Want to focus on stock levels? Cool. More interested in turnover rates? Go for it. The best part is you're not building from zero - there's already a solid framework there. Just tweak the layout, throw in whatever widgets you need, dump the useless stuff. I always tell people to grab a basic template first, then slowly customize it once you see what data everyone's actually looking at. Way less overwhelming that way.
Honestly, dashboards are game-changers for supply chain stuff. You get real-time visibility into everything - inventory, supplier performance, shipping delays, demand patterns. It's way better than drowning in spreadsheets for hours (been there, done that). You can spot bottlenecks fast and make smarter decisions about procurement and distribution. The trick is setting up alerts for critical thresholds so you're not glued to your screen 24/7. I'd start with your biggest 3 pain points and build dashboard views around those first. Trust me, it's like having superpowers once you get it dialed in.
Honestly, your biggest headaches will be messy data and getting people to actually use the thing. Most companies have inventory info spread across like 5 different systems, and half of it hasn't been updated since 2019. First thing - audit where your data lives and set some basic cleanup rules. User adoption is huge though. Train people properly and build something that solves their actual problems, not whatever the IT department thinks is cool. I'd start with just one team, get them hooked on it, then roll it out wider once you've got some wins under your belt.
Honestly, mapping your deliveries is a game changer. You'll instantly see where drivers are taking stupid long routes or shipping from warehouses across the country when there's one right next door. Visual patterns make the problems super obvious - like where to bundle shipments together or which routes are totally messed up. I'd start by mapping your delivery zones against actual drive times first. You'll probably find some weird bottlenecks you never noticed. It's basically like getting a helicopter view of all your shipping disasters, but in a good way that actually helps you fix them.
Dude, automation is a game changer for dashboard data. Your inventory counts get way more accurate since you're not dealing with manual entry mistakes anymore. Real-time updates start flowing in from warehouse systems, scanners, all that IoT stuff - suddenly you can actually see what's happening live. Stock movements, reorder triggers, predictive stuff that was impossible before. I'd probably start with your most critical data feeds first (the ones that actually matter to your day-to-day), then build out from there. Honestly once you see how much clearer everything becomes, you'll wonder why you waited so long.
Honestly, line charts are your best friend here - track inventory levels daily, weekly, whatever works for your business. I'd stack different products on the same chart so you can actually see what's happening across categories. The seasonal stuff jumps out immediately, which is pretty cool. Moving averages help cut through all the daily noise. Oh, and definitely overlay your demand forecasts so you can see how badly you guessed (or didn't). Start with your top SKUs first, then add more as you go.
Start with inventory turnover and stockout frequency - those show if stuff's actually moving or just sitting there. Days of inventory on hand is clutch too. Honestly, demand forecasting accuracy will save your butt because explaining why you're out of the hot item during busy season sucks. Reorder point performance matters for the same reason. ABC analysis is super helpful since it shows which products actually make money vs the ones hogging warehouse space. Oh, and these five will catch most problems before they get expensive. Way better than scrambling later.
Talk to the actual people using your dashboards - warehouse managers, logistics folks, whoever's glued to these things all day. Quick surveys work great after each update. Maybe set up short sessions where you just watch them click around (super revealing, honestly). Even a basic Slack channel for complaints is gold. Make it brain-dead simple for them to tell you what's broken or annoying. Analytics will show you what they're actually clicking vs what they claim they need - those don't always match up. Oh, and start gathering this stuff before your next sprint kicks off so you can actually use it.
Just use Google Sheets or Excel first - they're way more powerful than people think. You can track stock levels, set up alerts when stuff's running low, and make decent dashboards for free. Honestly? I've watched so many small businesses blow money on expensive software they don't even need. Track like 3-5 basics: what you have, what's selling fast, and when to reorder. That's it. Maybe I'm old school but spreadsheets handle most inventory headaches just fine. Once you actually outgrow them (and you'll know when), then look at Zoho or inFlow. Don't overcomplicate it from day one.
No Reviews