


Stock Inventory Management Kpi Dashboard




Try Before you Buy Download Free Sample Product
 Impress Your
 Audience
 100%
100% Editable
 Save Hours
 of Time


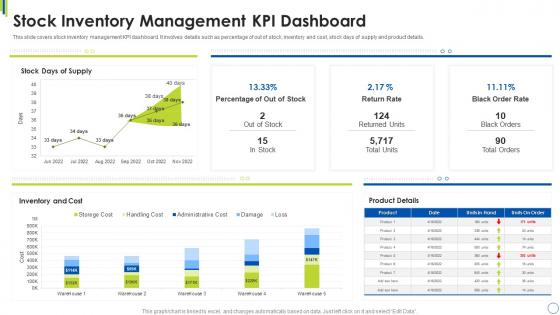
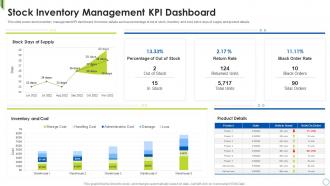
This slide covers stock inventory management KPI dashboard. It involves details such as percentage of out of stock, inventory and cost, stock days of supply and product details.
People who downloaded this PowerPoint presentation also viewed the following :
Stock Inventory Management Kpi Dashboard with all 7 slides:
Use our Stock Inventory Management Kpi Dashboard to effectively help you save your valuable time. They are readymade to fit into any presentation structure.





FAQs for Stock Inventory
Honestly, start with inventory turnover ratio - it's like the holy grail of figuring out if you're buying smart and predicting demand right. Then track your stockout rate (running out of stuff), fill rate (actually having things when customers want them), and carrying costs. Order accuracy is massive too because shipping the wrong thing just screws everything up. I'd probably do weekly tracking if you can handle it, monthly at the very least. Oh and definitely set up some kind of dashboard - way easier to catch problems early instead of scrambling later. These five will tell you pretty much everything about how your warehouse is actually performing.
So inventory turnover is basically how fast you're selling through your stock. Higher turnover means you're moving products quickly - less money sitting around in warehouses, lower storage costs, products stay fresh. Think of it like your business pulse rate, honestly. When turnover drops, that's when things get messy. Products pile up, warehouses get clogged, orders start getting delayed. I'd check this monthly if I were you. If you notice it slowing down, figure out which items aren't moving and tweak your ordering. It's one of those metrics that sounds boring but actually tells you everything.
Honestly, lead time is way more important than it sounds. It affects literally everything - your reorder points, safety stock, when you run out of stuff. Once you nail down your supplier lead times, you can actually predict when to reorder instead of just guessing. Your fill rates get better too since you're not scrambling to catch up on delayed orders. I learned this the hard way when we kept running out of our best sellers. Track those times religiously and use the data to set smarter reorder triggers. It's boring but it'll save your sanity.
DSI basically shows you how fast you're moving inventory - think of it as your stock's speedometer. Compare yours to industry averages and your past numbers. If it's creeping up, you're probably sitting on too much stuff or have dead inventory eating your cash. Monthly tracking is key here. Lower DSI usually means better cash flow since you're turning things over faster. But honestly, don't go crazy low or you'll run out of popular items. I learned this the hard way once! Use the data to tweak your buying decisions and figure out which products are lagging.
Honestly, start with inventory turnover - that's your biggest tell for how fast stuff's moving. Track your reorder point accuracy too, plus days sales outstanding. Stock-out frequency is obvious but critical. Bad demand forecasting will absolutely wreck you, so monitor that religiously along with safety stock levels. ABC analysis is clutch for figuring out which products need babysitting. Oh, and fill rates - can't believe I almost forgot that one. Set up weekly reviews with automated alerts when things go sideways. Way better than playing catch-up all the time.
So carrying cost is all the money you're bleeding just to store inventory - storage fees, insurance, stuff going bad, plus the cash you could've invested elsewhere. Most businesses don't realize it hits 20-30% of inventory value per year, which is honestly brutal. The whole point is finding that balance where you're not running out of stock but also not paying crazy storage costs. I learned this the hard way at my last job - we were sitting on way too much product. Calculate yours as a percentage of what your inventory's worth. Trust me, the number will probably make you want to clean house immediately.
GMROI shows you which products actually make money efficiently - just gross margin dollars divided by average inventory investment. Focus your buying on high GMROI stuff since they generate more profit per dollar tied up in stock. Low GMROI products? They're basically cash drains that aren't delivering returns. Either negotiate better costs, bump up pricing, or cut back those orders. Honestly, I'd rank all your SKUs by GMROI first - makes it way easier to see which ones deserve more of your buying budget. It's like... why throw money at inventory that sits there doing nothing for you?
So first figure out which KPIs actually matter for your business - don't just track everything. Then grab inventory software like NetSuite or TradeGecko that automatically monitors turnover rates and carrying costs. Barcode scanners are worth it too since manual counting is such a pain (learned that the hard way). Cloud dashboards let you see everything in real-time, which is clutch for catching issues early. Most of this stuff plays nice with whatever ERP you're already using. Honestly, anything beats trying to manage it all in Excel - that gets messy fast.
Fill rates are like your inventory report card - shows how often you actually have stuff when customers want it. Anything above 95% means you're crushing it with demand forecasting. Below that? You're probably understocking popular items or your timing's screwed up. Track it weekly by category so you can catch problems early. I learned this the hard way when we kept running out of our bestsellers every Friday (annoying). It's basically the "did we have what we promised" test. Adjust your safety stock when you see patterns, otherwise customers get pissed.
Check out your industry's typical numbers first - most retail does 4-12 inventory turns yearly. Then dig into what your competitors are reporting (trade publications are actually pretty useful for this). Your suppliers might share benchmarking data too, which is cool when they do. But honestly? Start with your own historical stuff - pull 2-3 years of data so you've got a solid baseline. The tricky part is making sure you're comparing similar businesses. Size matters, seasonality matters, product types matter. Otherwise you're just comparing random numbers that don't mean much for your situation.
So shrinkage totally screws up your inventory tracking - you'll have this gap between what the computer thinks you have and what's actually there. Your accuracy percentages go to hell, turnover rates get weird, and COGS calculations become basically useless. The problem just gets worse over time too. Missing even 2-5% from theft or damage makes your forecasting completely unreliable, so you end up with too much of stuff nobody wants and running out of bestsellers. Honestly, monthly cycle counts are your best friend here - they'll help you spot patterns and fix your buying before things get out of hand.
So ABC analysis is pretty straightforward - you sort your inventory into high, medium, and low value buckets. The expensive stuff (A items) gets watched like a hawk with daily turnover checks and strict service levels. Medium value items get moderate attention. Low-value crap? Don't stress about it. Seriously, who cares if you've got too many staplers sitting around? Focus your energy on what actually moves the needle financially. Run that 80/20 breakdown on your current stock first - you'll probably find like 20% of your items drive most of your revenue. Makes the whole thing way more manageable.
Check your stockout frequency and fill rates first - that's what actually matters. I usually go with 95% service level to start, but it really depends on your industry. Calculate the standard deviation of demand during lead times, then multiply by your service level factor. Short bursts work better than long explanations here. Test different safety stock levels for a few months and see how your KPIs respond. The goal is hitting high fill rates without drowning in inventory costs - honestly, it's more art than science sometimes. Track customer satisfaction scores too since they'll tell you if you're on the right track.
Dude, slow inventory is a total cash killer. Your money just sits there doing nothing while you're still paying for storage and insurance. Worse part? Items get outdated or spoiled the longer they sit around. Had to learn this the hard way at my old job - seasonal stuff especially. You'll probably end up slashing prices or writing things off completely, which obviously sucks for profits. Set up some kind of alert system for anything that hasn't moved in like 3 months. Check your turnover ratios regularly too. Trust me, catching this early saves major headaches later.
Don't compare December to November - you'll think your metrics are totally screwed when really it's just holiday madness. Compare December to last December instead. Pull like 2-3 years of data first to see your actual patterns. Then set up different target ranges for busy vs slow seasons. Your safety stock needs to go up before peak times and back down when things chill out. Honestly, seasonal forecasting models are your friend here - they account for all those cyclical swings. Otherwise you're flying blind every time the seasons change.
-
Thanks to SlideTeam, we have an ideal template to present all the info we need to cover. Their slides give our numbers and projections a more clear and enchanting look.
-
Informative and engaging! I really like the design and quality of the slides.