Volatile stock market data is hard to understand and harder to explain. Whether you are a lone investor or an investment manager, SlideTeam’s Stock Market Dashboard Templates will make your work easier and help you make informed decisions. These decisions can change your life.
Ronald Wayne has been dubbed the ‘unluckiest man’ on Earth. In 1976, just 12 days after the founding of Apple, he sold his 10% share in the company for $800. Today, that stock is worth $95 billion. Wayne does not regret his decision, saying he made the “best decision based on the information available at the time." Facebook’s Sean Parker commissioned renowned graffiti artist David Chloe to paint murals at the company's first headquarters. He accepted stocks as payment for his work. They are now valued at hundreds of millions. It was an unpredictable jump because Facebook was still a tiny startup social media company.
When do you hold ‘em, and when do you fold ‘em? How do you decide? You need the right tools for the job.
Portfolio Dashboard Templates to Keep Track of Investments
That’s where SlideTeam comes in. As presented in this blog, we offer content-ready and 100% editable templates that save you time and energy. Using one (or more) of these templates, you can deliver financial insights and forecasts to clients and team members. This helps you present your decisions with supporting information that satisfies the audience.
You will use charts, graphs, and tables to deliver data in an easy-to-understand format that helps the audience follow your presentation. The slides within this blog enable you to deliver relevant strategies, analytics, risk assessment, resource allocation, stock performance, icons, etc.
These readymade Stock Market Dashboard Templates provide a starting point, a solid framework, and the flexibility to tailor the slides to your needs. So, no more starting from scratch!
Let us tour these templates and see what they have to offer.
Template 1: Stock Market PPT Infographics Template
This PPT Deck presents the right visual impact to your stock market presentations. The slides contain readymade images and titles to showcase upward and downward trends, stock market indices for global, regional, national, etc. levels, worldwide stock locations and values, etc. The slides also enable you to present real-time updates and analyses to stakeholders. Download now for a quick, recent summary of the stock market.
Template 2: Stock Market Risk PowerPoint Template Bundles
Stock market investments have risk built into them. They can’t be entirely terminated but can be mitigated and managed with this PPT Deck. Use this template to present tabulated assessments that showcase risk management software comparative analyses, market risks of stocks, investment risks, and more. The risk levels are shown with color-coded icons to make the presentation easy to follow. Download this deck now to make informed decisions based on the risks involved.
Template 3: Stock Market Risk Management Strategies PowerPoint Presentation Slides
This 57-slide deck allows you to deliver a comprehensive presentation on the risk mitigation strategies in stock market investments. Present information and inferences on data through visuals with slides on risk tolerance analysis, risk-reward matrix, resourceful asset allocation, what-if modeling, investment objectives, key driver analytics and capacity planning, scheduling, etc. The PPT Set helps you present your approach towards the portfolios that handle and explain its reasoning. Get this template now to alleviate your clients’ stress.
Template 4: Semi-Circle Stock Market Analytical Functions General Operations
This template bundle presents a collection of slides that morph the semi-circle into a must-have presentation tool. Use this template to share details of your work through attractive diagrams that do the work for you. Along with the stick market information, present information on skills, salary, analytics, etc. Grab this deck now to put the semi-circle to use today!
Template 5: Pro Investing Stocks PowerPoint Presentation and Google Slides
This deck is dedicated to pro-investing stocks. The slides begin with the definition and showcase its benefits, timeline, types, market analysis, organization structure, etc. Showcase the strategies to diversify the portfolio, manage risks, understand the tax implications, etc. Grab this template from the link below and become a pro at pro-investing stocks.
Template 6: Stock Market Dashboard Highlighting Price Moving Average Trend
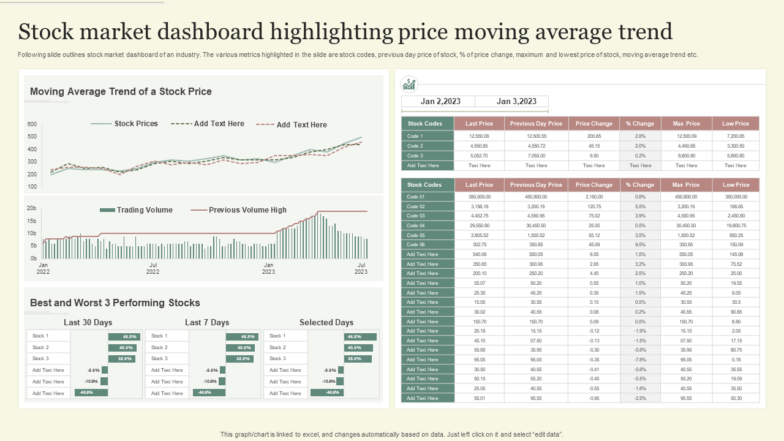
This single-slide template helps you deliver a one-stop analysis of price moving and the trend that can be inferred from it. The chart showcases the moving average trend of a stock price, tabulate the three best and worst performing stocks, and a legend table with stock codes along with their last price, previous day price, change, and maximum and lowest price. Download now to take the audience through the price-moving trends of relevant stocks.
Template 7: KPI Dashboard of Stock Market Risk Analysis
Deliver key performance indicators (KPIs) when you conduct a stock market risk analysis with this dashboard template. Graph the stock trading volume with time, the best and worst performing stocks in a given period, and tabulate each stock's price details and risk levels. Grab this slide now.
Template 8: Stock Market Dashboard Illustrating Six Months Price Trend
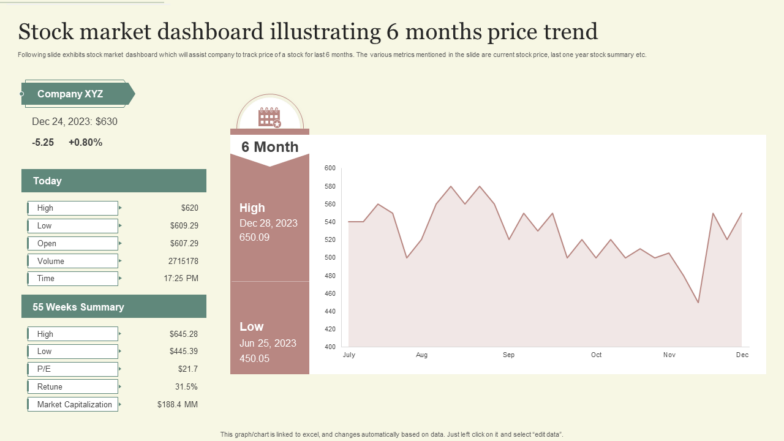
Six months is an excellent duration to analyze stock market trends. Showcase the stock price graph, not its highs and lows, along with the current and summary price details in the space provided in the layout. Download now from the link below.
Template 9: Dashboard For Tracking Global Stock Market Indices
This PPT Slide presents the current value and trend for several global stock indices. The layout presents space for nine indices, such as Dow 30, NASDAQ, and S&P 500. There is enough space to detail each stock and present comments, including a legend at the bottom. Download this template now to create a real-time reference for stakeholders.
Template 10: Stock Market Dashboard Highlighting Cash Flow and Profitability Analysis
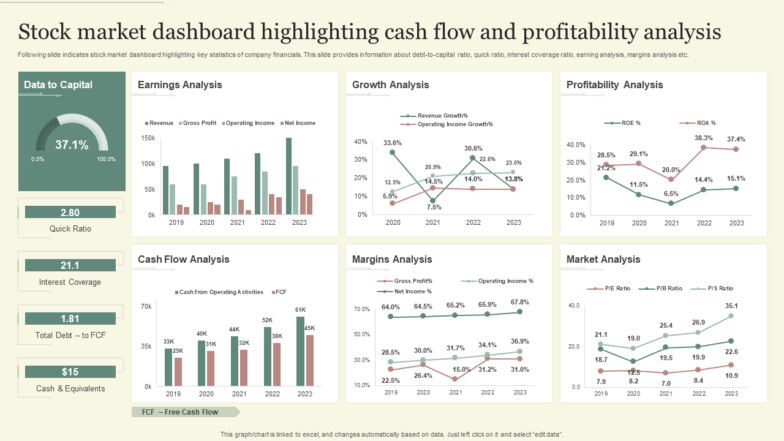
This PPT Layout can be used to present cash flow and profitability in real-time against a changing stock market. Showcase details on earnings, growth, profitability, cash flow, etc., with graphs that help you take the audience on a visual journey. There is enough space to note down inferences such as interest coverage, total debt, cash, etc. Download now from the link below.
Investments Made Easy
Accurate, precise, and real-time information and updates make stock investments successful. SlideTeam’s Stock Market Dashboard Templates give you the proper medium to deliver this information whenever needed. Make them yours.
Access these slides with a single click and streamline your investments. You can choose one of our subscription services: monthly, semi-annual, annual, annual+ with a click here.
P.S. The templates in this blog are not ranked in any particular order. Pick the one(s) you like and download it!


 Customer Reviews


