


Retail Store Dashboard Snapshot With Sales Kpis


Try Before you Buy Download Free Sample Product
 Impress Your
 Audience
Editable
of Time


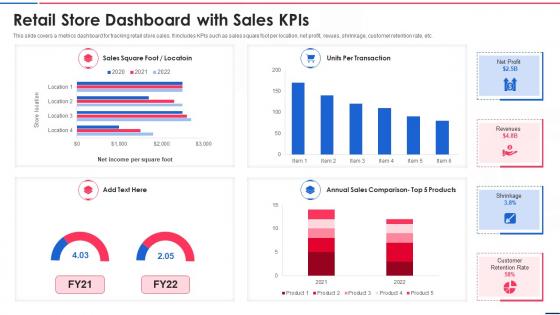
This slide covers a metrics dashboard for tracking retail store sales. It includes KPIs such as sales square foot per location, net profit, revues, shrinkage, customer retention rate, etc.
People who downloaded this PowerPoint presentation also viewed the following :
Retail Store Dashboard Snapshot With Sales Kpis with all 7 slides:
Use our Retail Store Dashboard Snapshot With Sales Kpis to effectively help you save your valuable time. They are readymade to fit into any presentation structure.


FAQs for Retail Store Dashboard Snapshot
Focus on sales stuff first - revenue, conversion rates, average order value. Then track your inventory turnover and stock levels. Customer metrics matter too, like traffic and lifetime value. Honestly, most people go overboard with dashboards that look impressive but don't actually help. Basket abandonment and profit margins by category are clutch though. Pick maybe 6-8 metrics max that'll actually alert you when something's wrong. I'd start there and add more later if you need them for specific issues your store faces.
So basically you get real-time stock visibility across all your stores, which is honestly a game-changer. Quick alerts when stuff hits reorder points. You can see what's flying off shelves vs. what's just sitting there forever. The trend tracking helps you predict seasonal demand too - way fewer stockouts during rush periods. Less cash wasted on inventory that won't move. Oh, and you'll spot overstock situations before they spiral. Honestly, just start with automated low-stock alerts if nothing else. That one thing will save you so much stress.
Tableau and Power BI are probably your best bet - they're pricey but handle retail data really well. Google Data Studio is decent if you're watching costs. Honestly, I've seen teams blow tons of money on fancy dashboards when basic Excel would work fine for smaller stores. The main thing is making sure whatever you pick connects easily to your POS and inventory systems. Oh, and don't get caught up in all the bells and whistles at first. Figure out what data you actually have access to, then choose the tool that works best with those sources. That'll save you a headache later.
Dude, real-time data is seriously clutch. Instead of waiting around for yesterday's reports, you'll catch problems while you can actually fix them. Like seeing which items are about to sell out or noticing your store's packed so you need more staff. Pricing screw-ups? You'll spot those instantly too. Honestly, I used to hate staring at dashboards all day, but now I just set up alerts for the big stuff. That way important things ping me automatically. Oh, and tracking how promos are doing in real-time is pretty sweet - way better than the old guessing game.
Honestly, data visualization is a game-changer for retail. You can't be scrolling through endless spreadsheets when you need quick answers about sales, conversion rates, or inventory. Charts and graphs let you instantly see what's working - like which products are selling fast or where your marketing dollars are paying off. Plus you'll catch underperforming stores right away instead of finding out weeks later (been there). The key is keeping your visuals clean and focused on metrics that actually matter for decisions. I swear, once you start using good dashboards, going back to raw data feels like torture.
Retail dashboards are honestly a game changer - you can see everything customers do in one spot. Like which products they check out before buying, how much time they're spending in different areas, what makes them bail or return stuff. It's basically x-ray vision for shopping habits (sounds dramatic but it's true). You'll want to segment customers by age, buying patterns, all that jazz to find new opportunities. Oh and definitely set up real-time tracking - old data is pretty useless. Start small though, pick 2-3 metrics you actually care about first.
Make your data super easy to scan - good visuals, stuff that updates live, and let people customize what they see. Drag-and-drop is clutch, plus mobile needs to actually work well. Set up alerts when numbers go crazy. If it takes more than 5 minutes to figure out, you've made it too complicated honestly. The good ones let you click from big picture metrics down to the nitty-gritty details without jumping through hoops. Oh and start simple - figure out the top 3 decisions your team makes daily and build around those first. You can always add more later.
So basically, retail dashboards are game-changers for forecasting because everything's right there visually instead of you hunting through endless spreadsheets. You can actually see the patterns - like seasonal bumps, which products are killing it, customer habits changing. Most of them let you add outside stuff too like weather data, which honestly makes a huge difference for accuracy. The cool part is it updates in real-time, so you're not working with stale numbers from last month. I'd start with your best-selling categories first since those give you the most reliable foundation to work from.
Start with the metrics that actually matter - revenue, inventory turns, conversion rates. Put those right where you can't miss them. Simple charts work best, maybe some color coding so trends pop out right away. I swear, half the dashboards I see are just metric overload - total mess. Group related stuff together so it makes sense when you're scanning through. Speed matters too since you'll probably be refreshing this thing all day. Oh, and definitely test it with whoever's gonna use it first. They always spot the annoying stuff you don't notice.
So I'd set up those KPI widgets to track stuff like sales per hour, conversion rates, and customer satisfaction for each person. Most dashboards let you filter by employee or shift - super helpful for spotting who's crushing it and who needs help. The real-time thing is honestly amazing, way better than waiting around for monthly reports. Oh, and you can set alerts when someone hits their daily target or whatever. I'd probably start with just 3-4 metrics that actually matter instead of going crazy tracking everything under the sun.
Honestly, start with the stuff that actually affects your money - sales numbers, what's flying off shelves vs collecting dust, and how customers behave in your space. Traffic patterns are way more telling than random page views (learned that the hard way). Conversion rates will become your best friend. Oh, and don't sleep on the boring operational things like how well your team scheduling works or if suppliers are flaking on you. Keep it simple though - maybe 5 key metrics tops. Your team needs to get comfortable with data first before you go crazy adding more.
Okay so basically you'll want to compare year-over-year and month-over-month stuff in your dashboard. Weekly patterns too. Different product categories are gonna have totally different seasonal behaviors - like swimsuits vs winter coats, obviously. Set up some automated alerts when things hit certain numbers. Oh and use rolling averages to cut through all the daily ups and downs noise. Start with comparing this year to the same time last year. Honestly the coolest part is when you spot those subtle shifts alongside the obvious holiday spikes. Your data will definitely tell a story once you layer those timeframes right.
So basically, dashboards show you all your sales channels at once - stores, online, social, marketplaces, whatever. Real-time data on everything. You can actually see which channels are killing it and which ones... aren't. Plus you're tracking inventory across all of them, spotting where customers convert best. Trust me, when you're managing like five different channels, this stuff saves your sanity. The trick is picking the right metrics for each channel. Then when something's working (or totally bombing), you can shift your budget around fast. Way better than flying blind and hoping for the best.
Don't cram everything onto one screen - people get paralyzed when there's too much to process. Vanity metrics are the worst too. Like showing revenue going up while profit margins are secretly dying (been there, seen that mess). Your "real-time" data better actually be real-time, not updating once a day. Context matters - add seasonality comparisons so numbers make sense. Honestly, most roles only need 3-5 KPIs that actually move the needle. Test with real users first because what looks good to you might confuse everyone else.
So basically you just drop forecasting models right into your dashboard widgets - stuff like demand charts, inventory warnings, customer value predictions. Tableau and Power BI make this pretty easy through their APIs or built-in ML features. Here's the thing though - your predictions need to actually make sense to people using them. Nobody wants some weird algorithm gibberish, you know? Better to show "reorder Product X in 2 weeks" than some probability score. I'd honestly start with just sales forecasting first. Once your team gets the hang of reading that data, then you can add more complex stuff.
-
The templates are handy and I can personalize them as per my needs. Glad to be your subscriber!
-
One word for SlideTeam–Versatile!