


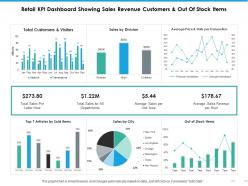
Retail kpi dashboard showing sales revenue customers and out of stock items






Try Before you Buy Download Free Sample Product
 Impress Your
 Audience
 100%
100% Editable
 Save Hours
 of Time


Have it completed exactly as you desire with our Retail Kpi Dashboard Showing Sales Revenue Customers And Out Of Stock Items. Get it done absolutely correct.
People who downloaded this PowerPoint presentation also viewed the following :
Retail kpi dashboard showing sales revenue customers and out of stock items with all 5 slides:
Draw buyers to your doorstep with our Retail Kpi Dashboard Showing Sales Revenue Customers And Out Of Stock Items. They excel at attractive advertisement.

FAQs for Retail kpi dashboard showing sales revenue customers and out
Okay so the must-haves are sales per square foot, conversion rate, average transaction value, and inventory turnover. Those four tell you basically everything. Gross margin percentage too - making money without profit is just... well, pointless busy work lol. After that? Customer acquisition cost and return customer rate show if your customers actually stick around. Cart abandonment matters if you're doing online stuff too. Honestly, start with those seven and you're golden. You can always add weird niche metrics later depending on what you're selling.
Dude, having a retail KPI dashboard is a total game-changer. You get to see what's happening in your store right now instead of guessing or waiting around for reports. Flying off the shelves? Slow Tuesday afternoons? You'll catch it immediately. I'm not gonna lie, checking the numbers becomes pretty addictive once you get into it. When something changes, you can actually do something about it - switch up your staff schedule, reorder inventory, whatever needs fixing. My advice? Don't go crazy trying to track everything at first. Pick your top 3 or 4 metrics and start there.
Honestly, most people go with **Tableau, Power BI, or Google Data Studio**. Tableau's amazing for complex stuff but costs a fortune. Power BI works great if you're already in the Microsoft ecosystem. Google Data Studio is free and pretty solid, though it can be annoying sometimes - I've definitely cursed at it before. **Looker and Qlik Sense** are decent too. Hell, even **Excel with Power Query** works for basic dashboards. Thing is, you want something that actually connects to your POS and inventory systems without being a nightmare. Figure out what data sources you're working with first. Then pick based on your budget and how tech-savvy your team is.
Daily updates are your best bet for sales, traffic, and conversion stuff - that data moves too fast to wait around. For things like inventory turnover and customer acquisition costs, weekly's totally fine since they don't shift as much. Honestly? I've watched teams go crazy trying to track everything in real-time, but most KPIs don't need that level of obsession. Match your update frequency to whether you can actually do something with the info. No point stressing over hourly sales if you can't react to it anyway. Just set up some automated refreshes so your team sees current numbers without the manual hassle.
So foot traffic is basically what makes everything else work in retail. More people coming in usually means better sales and conversion rates - it's like the first domino that gets everything moving. Though obviously you want quality visitors, not just random browsers wandering around. Track when people actually show up during the day and week, then you can schedule staff better and time your promotions right. Busy periods need more efficient operations anyway. You'll notice foot traffic ties directly to how fast inventory moves and even how productive your team is. Pretty much drives your revenue per square foot too.
Honestly, just track the basics first - wait times, return rates, customer satisfaction scores. That stuff shows you problems fast. Pull your cart abandonment and support ticket data into one dashboard too (makes life way easier). I'd focus hard on conversion rates by channel and whether people actually come back to buy again. The real trick? Set up alerts when numbers go wonky. Trust me, catching issues early beats dealing with angry customers later. Oh, and the data usually tells you more than complaints do anyway - people complain about weird stuff sometimes but the numbers don't lie.
So inventory turnover is just how fast you're selling through your stock - like how many times you clear out everything in a year. Super important for your dashboard because it shows if cash is getting stuck in products that won't move. When it's low, you're basically bleeding money on dead inventory (and probably cursing your storage costs). High turnover means you're killing it with sales and buying smart. I'd track it by product category and set up alerts when it dips below whatever benchmarks work for your industry. That way you can jump on promotions or adjust orders before things get ugly.
Honestly, the easiest way is connecting your e-commerce API straight to your dashboard - Shopify, WooCommerce, whatever you're using. Most have decent APIs for real-time data. Set it to refresh hourly or daily, whatever makes sense for your business. The annoying part? Matching your online categories with in-store ones. Total pain but worth it once it's done. Track conversion rates and cart abandonment with your usual retail metrics. Oh, and average order value - that one's clutch. Start simple though, don't go crazy with fancy integrations right away. Build it up as you figure out what data actually matters to you.
Honestly, turning your KPIs into visuals is a game changer. Raw spreadsheets are just soul-crushing to look at - nobody wants to dig through rows of numbers to find what matters. With infographics or even basic charts, you'll spot problems way faster and your team will actually pay attention to the data. Stakeholders eat up clean visuals in meetings too. I'd start simple though - pick your top 3-5 metrics and make basic dashboards in Excel or whatever. You don't need anything fancy at first. Once you see how much easier it makes decision-making, you'll wonder why you waited so long.
Yeah, you definitely want to switch up your KPIs based on the season. Holiday rushes? Focus on inventory turnover, conversion rates, and how much people are actually spending per order. That's when the money's flowing and you can't afford to miss out. But honestly, those quieter months are gold for digging into the boring stuff - customer acquisition costs, who's actually sticking around, profit margins. You know, all that analysis that gets thrown out the window when you're drowning in Black Friday chaos. I'd set up different dashboard templates so you can flip between them easily. Way less headache than scrambling to figure out what matters when.
Honestly, I'd start with sales per hour and conversion rate - that's your bread and butter right there. Average transaction value tells you if they're actually selling or just going through the motions. Oh, and units per transaction is huge because it shows who's bothering to upsell vs. who just wants customers out the door fast. Customer satisfaction scores matter too, assuming you track those things. Nobody wants a salesperson who brings in money but makes people hate shopping there. Those four metrics will show you pretty quick who gets it and who doesn't.
Look at revenue lift first - that's your main thing. Compare promo sales to normal baseline numbers. Conversion rates and average order value matter too, obviously. Traffic spikes are nice but don't get too excited about vanity metrics. The tricky part is figuring out if you're getting genuinely new sales or just moving existing ones around (so many people miss this). Customer acquisition cost tells you if you're attracting actual buyers or just deal-chasers who'll bounce. Set up automatic tracking so you can pivot mid-campaign when something's clearly not working. Saved me tons of headaches.
Conversion rates show what percentage of your visitors actually buy something. Think of it as separating real customers from people just killing time. If yours is low, maybe your prices are weird, your product photos look sketchy, or checkout is a nightmare. Honestly, I'd rather have 100 visitors who convert well than 1000 who just bounce. Traffic numbers can be deceiving that way. Try testing different product page layouts and make your checkout stupid simple - those usually help the most.
So retention rate, repeat purchases, and customer lifetime value are your big three - they'll tell you almost everything. Also track time between purchases and segment your churn data. Getting clean data from everywhere is honestly the worst part, but once you nail that down you'll start seeing cool patterns. Like maybe people bail after winter or certain products are total customer magnets. Oh and definitely set up alerts when your numbers tank so you're not scrambling later. The automated alerts thing has saved my butt more times than I can count.
Oh man, data chaos is the worst part. Your POS, inventory system, and online store all talk in completely different formats - it's such a pain to sync everything up in real time. Staff training is huge too because untrained teams just stare at dashboards like they're hieroglyphics. Plus you get that thing where people obsess over every metric and can't focus on what actually moves the needle. Honestly? Pick like 5-6 KPIs that directly hit your revenue, nail those first, then add more later. Don't try to boil the ocean right away.
No Reviews