

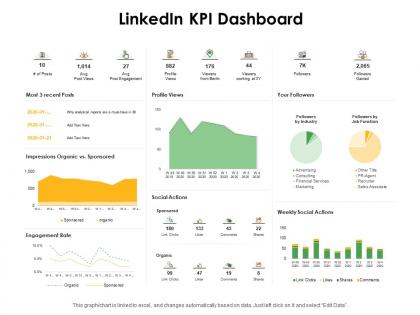
Linkedin kpi dashboard ppt powerpoint presentation outline picture




Try Before you Buy Download Free Sample Product
 Impress Your
 Audience
 100%
100% Editable
 Save Hours
 of Time


Our Linkedin KPI Dashboard Ppt Powerpoint Presentation Outline Picture are topically designed to provide an attractive backdrop to any subject. Use them to look like a presentation pro.
People who downloaded this PowerPoint presentation also viewed the following :
Linkedin kpi dashboard ppt powerpoint presentation outline picture with all 2 slides:
Use our Linkedin KPI Dashboard Ppt Powerpoint Presentation Outline Picture to effectively help you save your valuable time. They are readymade to fit into any presentation structure.
FAQs for Linkedin kpi dashboard ppt powerpoint
LinkedIn KPI dashboard metrics include profile views, connection requests accepted, post engagement rates, click-through rates on shared content, and follower growth percentage. These metrics enable professionals to track their networking effectiveness, content resonance, and personal brand development, with many sales professionals and executives finding that consistent monitoring drives strategic relationship building and enhanced business opportunities.
Higher LinkedIn engagement rates directly correlate with increased brand visibility through expanded reach, improved algorithm prioritization, enhanced social proof, and greater audience interaction metrics. These engagement indicators, tracked within KPI dashboards, enable marketing teams to measure content performance, optimize posting strategies, and demonstrate ROI, with many organizations finding that consistent engagement growth translates into measurable brand awareness and lead generation improvements.
Connection growth serves as a foundational metric for evaluating LinkedIn performance, indicating network expansion, brand reach, audience development, and relationship-building effectiveness across professional communities. This metric enables organizations to track networking ROI, assess content resonance with target audiences, and measure strategic outreach success, with many companies finding that consistent connection growth correlates directly with enhanced lead generation and business development opportunities.
Companies can track employee advocacy through LinkedIn KPIs including employee engagement rates, content sharing frequency, follower growth, post reach, and brand mention tracking. These metrics enable organizations to measure their workforce's social media impact by monitoring content amplification, network expansion, and brand visibility across professional networks, ultimately delivering enhanced employer branding and increased organic reach for business content.
Top tools for integrating LinkedIn analytics into centralized KPI dashboards include Hootsuite Analytics, Sprout Social, HubSpot Marketing Hub, Google Data Studio, and Tableau with LinkedIn's Campaign Manager API. These platforms streamline social media reporting by automatically pulling LinkedIn metrics, combining them with other marketing data, and creating comprehensive visualizations, with many marketing teams finding that centralized dashboards significantly enhance campaign optimization and strategic decision-making across channels.
LinkedIn KPIs should be reviewed weekly for tactical adjustments like content performance and engagement rates, while monthly reviews focus on broader metrics such as lead generation, follower growth, and conversion tracking. This dual approach enables organizations to quickly optimize underperforming content while strategically adjusting long-term campaigns, ultimately delivering improved ROI and stronger professional network engagement across sales and marketing teams.
Click-through rates on LinkedIn measure audience engagement quality and content effectiveness, directly indicating how well your messaging resonates with professional audiences. High CTRs demonstrate strong content relevance and targeting precision, with many B2B marketers finding that improved click-through rates correlate with better lead generation, enhanced brand authority, and ultimately higher conversion rates in professional networking environments.
Sentiment analysis of LinkedIn comments reveals audience emotional responses, engagement quality, and content resonance by analyzing positive, negative, and neutral reactions across posts. This enables organizations to identify which messaging drives meaningful conversations, adjust content strategies based on audience feedback, and enhance brand perception, with many marketing teams finding that sentiment insights significantly improve LinkedIn engagement rates and relationship building.
LinkedIn KPI benchmarks vary significantly across industries, with B2B technology companies typically achieving 2-4% engagement rates, professional services seeing 1-3% click-through rates, and manufacturing industries averaging 0.5-2% follower growth monthly. These benchmarks enable organizations to assess performance contextually, with many companies finding that industry-specific comparisons deliver more actionable insights than generic metrics, ultimately enhancing strategic social media investments.
**INPUT**: How does the frequency of content posting affect typical KPI performance on LinkedIn? **OUTPUT**: Consistent posting frequency significantly enhances LinkedIn KPI performance by increasing visibility, improving engagement rates, and strengthening audience retention across professional networks. Companies posting 3-5 times weekly typically see higher reach and connection growth, with many B2B organizations finding that regular content schedules drive sustained lead generation and brand recognition. [Word count: 52 words]
Demographic insights from LinkedIn dashboards include audience age distribution, geographic concentration, industry alignment, job level targeting, and company size preferences. These metrics enable strategic content timing, regional campaign optimization, and professional messaging refinement, with many B2B organizations finding that demographic analysis significantly enhances lead quality and conversion rates.
Lead generation efforts can be quantified through LinkedIn KPIs including lead conversion rates, connection-to-lead ratios, content engagement metrics, InMail response rates, and cost per qualified lead. These metrics enable sales teams to track prospect quality, optimize outreach strategies, and measure campaign ROI, with many B2B organizations finding that systematic KPI tracking increases lead generation efficiency by 40-60%.
**INPUT**: What strategies help improve a company's LinkedIn engagement score? **OUTPUT**: Effective LinkedIn engagement strategies include posting industry-relevant content consistently, encouraging employee advocacy, responding promptly to comments, sharing behind-the-scenes insights, and leveraging video content. These approaches enhance visibility by building authentic connections, fostering meaningful conversations, and establishing thought leadership, with many companies finding that strategic employee participation significantly amplifies their organic reach and engagement metrics. [Word count: 56 words]
Sponsored content metrics track paid performance through click-through rates, cost-per-click, conversion rates, and ROI, while organic reach metrics measure natural engagement via impressions, follower growth, and content shares. These complementary datasets enable marketing teams to optimize budget allocation, compare content effectiveness across channels, and balance paid investment with organic community building, ultimately delivering comprehensive social media performance insights.
Follower engagement serves as a critical indicator of LinkedIn community health, measuring meaningful interactions, content resonance, and audience quality rather than just follower quantity. High engagement rates through comments, shares, and reactions demonstrate authentic community building, with many organizations finding that engaged followers convert to leads, partnerships, and business opportunities more effectively than passive audiences.
No Reviews