


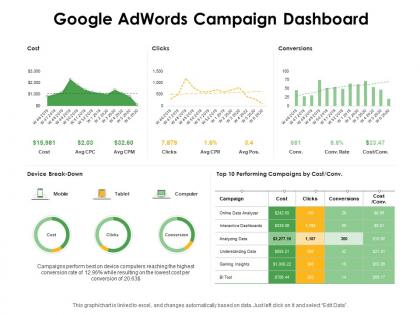
Google adwords campaign dashboard ppt powerpoint presentation ideas demonstration




Try Before you Buy Download Free Sample Product
 Impress Your
 Audience
 100%
100% Editable
 Save Hours
 of Time


Our Google Adwords Campaign Dashboard Ppt Powerpoint Presentation Ideas Demonstration are topically designed to provide an attractive backdrop to any subject. Use them to look like a presentation pro.
People who downloaded this PowerPoint presentation also viewed the following :
Google adwords campaign dashboard ppt powerpoint presentation ideas demonstration with all 2 slides:
Use our Google Adwords Campaign Dashboard Ppt Powerpoint Presentation Ideas Demonstration to effectively help you save your valuable time. They are readymade to fit into any presentation structure.
FAQs for Google adwords campaign dashboard ppt powerpoint
Here's what I track religiously: CTR, CPC, conversion rate, and ROAS. CTR tells you if people actually want to click your stuff. CPC is just what you're paying per click - pretty straightforward. I used to waste so much time staring at impression numbers, but honestly? They're kinda useless. Your conversion rate shows whether your landing page actually works with your targeting. ROAS is the big one though - that's your real money maker or breaker. Check these daily, then when something looks weird, dig into quality score and search terms. Those usually tell you what's going wrong.
Hit "Customize columns" and ditch all the useless metrics Google throws at you by default. Seriously, who needs half that stuff? Focus on what actually moves the needle - cost per conversion, ROAS, quality score, whatever you're tracking. Custom segments are clutch for filtering by device or location. Set up automated bid rules while you're at it. Pro tip: save your column setups as templates so you don't have to rebuild everything each time. Start with maybe 5-6 key metrics, then add more if needed.
So the main reports you'll want to check out are campaign performance (clicks, impressions, conversions), audience insights showing who's actually clicking your stuff, and search terms reports. Geographic and demographic breakdowns are there too. Honestly, search terms is where I always find the best negative keywords - total game changer. Oh, and asset performance reports if you're doing responsive ads. Start with campaign performance first to see the overall picture. Then dive into search terms and audience data to tweak your targeting. That's usually my go-to approach anyway.
So first thing - make sure you've got conversion tracking set up (kind of obvious but worth mentioning). Once that's running, the dashboard shows your ROAS and conversion rates in real time. You can see exactly which campaigns and keywords are actually making you money vs just burning through budget. Honestly, the filters are your best friend here - use them to dig into what's working and then just do more of that. Oh, and you can set up different conversion goals if you're tracking multiple types of actions. The ROAS column makes it pretty obvious which ads are winners and which ones... aren't.
So the audience demographics section basically shows who's clicking your ads - ages, gender, income, whether they have kids. Pretty useful stuff. You might notice something like way more 25-34 year olds are clicking than you thought they would. Look at which groups actually convert vs just browsing around (that's the goldmine right there). Once you spot your best performing demographics, bump up bids for those people and dial back spending on the ones that aren't working. Also helps with tweaking your ad copy to match whoever's responding best. Start there and see what patterns jump out.
Check your Keywords tab and sort by cost-per-conversion from highest to lowest - that's honestly the fastest way to spot which keywords are bleeding money. Look for CTR under 2% and Quality Scores below 5. The search terms report is clutch here since it shows exactly what people searched. I'd also pause anything with high CPC but zero conversions (kind of obvious but you'd be surprised). Don't forget to add the worst performers as negative keywords instead of just pausing them. Oh and filter by different date ranges - sometimes patterns only show up over time.
So basically ad schedules show you when your ads actually work vs when you're just throwing money away. Like you'll see patterns - maybe your B2B stuff gets zero clicks on weekends, or your restaurant ads go crazy during lunch rush. The dashboard breaks down performance by hour and day. Honestly, most people ignore this data but it's pure gold. You can pause ads during dead times and crank up bids when people are actually paying attention. Start with the hourly breakdown first - that's where the biggest money-saving opportunities are hiding.
So Google Ads Dashboard shows you real-time spending and forecasts - super helpful for tracking where your money goes. I always set up those automated alerts when I'm close to hitting budget limits. Saves me from panic moments when campaigns eat through cash way too fast lol. The forecasting stuff uses your current spend rate to predict performance, plus you can check historical data for planning. Oh and you can tweak budgets instantly and see what'll probably happen. Honestly, just set up those alerts first thing - you'll thank me later when you're not scrambling at month-end.
Yeah totally! Go to Tools & Settings > Linked accounts > Google Analytics in your Ads dashboard to connect them. Takes a few hours for data to show up (which always feels like eternity lol). Once it's linked, you'll see Analytics stuff like bounce rate and session duration right in your Ads reports. Game changer honestly - finally know what people actually do after clicking your ads instead of just guessing. You can set up custom columns too and mix data from both platforms. Way better picture of how campaigns are really performing beyond the basic click numbers.
Dude, annotations are a lifesaver for tracking what actually caused your performance to change. Mark everything - new campaigns, bid adjustments, paused keywords - right on your charts. Going back weeks later trying to figure out why your CTR tanked? Total nightmare. I learned this the hard way lol. You'll see patterns way clearer when there's a visual timeline connecting your moves to the results. Honestly makes reporting so much less stressful. Just get in the habit of adding them for any big changes you make.
Go to your Google Ads Dashboard and click the "Locations" tab - that's where all the geographic data lives. It'll show you which cities, states, or countries are actually converting vs just eating your budget (honestly this feature is a goldmine). You can see clicks, conversions, cost-per-conversion, all broken down by location. Pretty eye-opening stuff. Use it to bump up bids in your winning areas and either exclude or dial down spend in the duds. I always forget to check this regularly but it's such an easy way to shift budget toward markets that actually work.
Honestly, I'd check daily for the first couple weeks when you're starting out. After that you can chill and just peek at it 2-3 times a week once everything's running smooth. Don't get crazy checking every hour though - I learned that the hard way lol. Your campaigns need time to actually collect data and figure things out. Weekly trends are way more useful than stressing over daily ups and downs. Time-sensitive stuff or tight budgets? Yeah, go back to checking daily. Set up some alerts for big problems so you're not totally in the dark between visits.
Give it at least 2-4 weeks before you freak out about performance. Daily swings mean nothing - I learned this the hard way lol. Attribution windows are tricky too since conversions can lag behind clicks by days. When comparing campaigns, make sure you're looking at similar timeframes. Here's what really matters though: check your actual business numbers against what Google's dashboard shows. Sometimes Google thinks you're crushing it but your bank account says otherwise. The conversion tracking might be set up wrong for what you actually care about. Short bursts of data will just stress you out.
Just go into your Google Ads dashboard and create a few different ad versions in the same ad group - let them run at the same time. The results will show up right there with all your click rates and conversion stuff. I'd test one thing at a time though, like headlines first, then maybe the description text. Wait until you get a few hundred clicks before deciding anything. Honestly I always get way too obsessed checking the numbers! Once you see what's working, pause the crappy ones and make new variations. Oh and start with at least 2-3 different ads per campaign - gives you better data to work with.
CTR is like your ad's report card - shows how many people actually click when they see it. Your Quality Score depends on this thing, which totally controls where your ads show up and what you pay. Bad CTR? Usually means your copy sucks or you're going after the wrong keywords. Honestly I check this metric way too often, probably not healthy lol. But here's the thing - if it starts tanking, swap out your headlines or fix your targeting fast. Otherwise you'll watch your costs just keep climbing and nobody wants that headache.
No Reviews